Immigrants from Liberia vs Croatian Householder Income Ages 45 - 64 years
COMPARE
Immigrants from Liberia
Croatian
Householder Income Ages 45 - 64 years
Householder Income Ages 45 - 64 years Comparison
Immigrants from Liberia
Croatians
$87,739
HOUSEHOLDER INCOME AGES 45 - 64 YEARS
0.2/ 100
METRIC RATING
270th/ 347
METRIC RANK
$108,383
HOUSEHOLDER INCOME AGES 45 - 64 YEARS
98.3/ 100
METRIC RATING
92nd/ 347
METRIC RANK
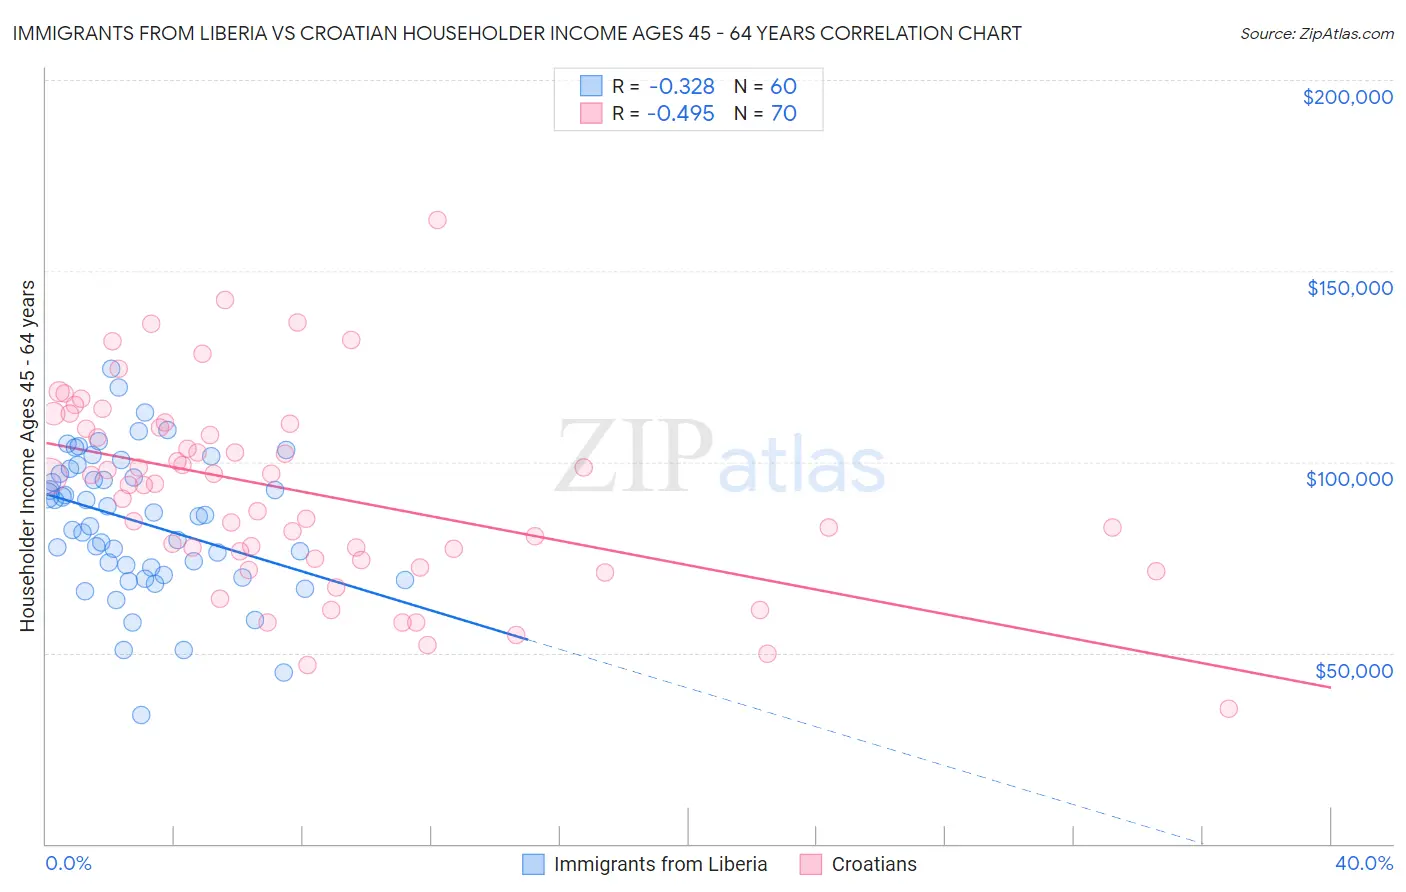
Immigrants from Liberia vs Croatian Householder Income Ages 45 - 64 years Correlation Chart
The statistical analysis conducted on geographies consisting of 135,189,052 people shows a mild negative correlation between the proportion of Immigrants from Liberia and household income with householder between the ages 45 and 64 in the United States with a correlation coefficient (R) of -0.328 and weighted average of $87,739. Similarly, the statistical analysis conducted on geographies consisting of 375,164,056 people shows a moderate negative correlation between the proportion of Croatians and household income with householder between the ages 45 and 64 in the United States with a correlation coefficient (R) of -0.495 and weighted average of $108,383, a difference of 23.5%.
Householder Income Ages 45 - 64 years Correlation Summary
| Measurement | Immigrants from Liberia | Croatian |
| Minimum | $33,597 | $35,326 |
| Maximum | $124,313 | $163,438 |
| Range | $90,716 | $128,112 |
| Mean | $84,202 | $92,198 |
| Median | $85,955 | $94,097 |
| Interquartile 25% (IQ1) | $71,300 | $74,551 |
| Interquartile 75% (IQ3) | $97,673 | $109,046 |
| Interquartile Range (IQR) | $26,373 | $34,495 |
| Standard Deviation (Sample) | $18,447 | $25,350 |
| Standard Deviation (Population) | $18,293 | $25,169 |
Similar Demographics by Householder Income Ages 45 - 64 years
Demographics Similar to Immigrants from Liberia by Householder Income Ages 45 - 64 years
In terms of householder income ages 45 - 64 years, the demographic groups most similar to Immigrants from Liberia are Guatemalan ($87,705, a difference of 0.040%), Spanish American ($87,836, a difference of 0.11%), Immigrants from Micronesia ($87,864, a difference of 0.14%), Cape Verdean ($87,580, a difference of 0.18%), and Spanish American Indian ($87,561, a difference of 0.20%).
| Demographics | Rating | Rank | Householder Income Ages 45 - 64 years |
| Immigrants | Senegal | 0.3 /100 | #263 | Tragic $88,421 |
| Osage | 0.3 /100 | #264 | Tragic $88,390 |
| Jamaicans | 0.2 /100 | #265 | Tragic $88,327 |
| Immigrants | West Indies | 0.2 /100 | #266 | Tragic $88,164 |
| Hmong | 0.2 /100 | #267 | Tragic $88,115 |
| Immigrants | Micronesia | 0.2 /100 | #268 | Tragic $87,864 |
| Spanish Americans | 0.2 /100 | #269 | Tragic $87,836 |
| Immigrants | Liberia | 0.2 /100 | #270 | Tragic $87,739 |
| Guatemalans | 0.2 /100 | #271 | Tragic $87,705 |
| Cape Verdeans | 0.2 /100 | #272 | Tragic $87,580 |
| Spanish American Indians | 0.2 /100 | #273 | Tragic $87,561 |
| Iroquois | 0.1 /100 | #274 | Tragic $87,255 |
| Immigrants | Belize | 0.1 /100 | #275 | Tragic $87,229 |
| Immigrants | Latin America | 0.1 /100 | #276 | Tragic $87,219 |
| Cree | 0.1 /100 | #277 | Tragic $87,185 |
Demographics Similar to Croatians by Householder Income Ages 45 - 64 years
In terms of householder income ages 45 - 64 years, the demographic groups most similar to Croatians are Immigrants from Croatia ($108,304, a difference of 0.070%), Ukrainian ($108,475, a difference of 0.080%), Immigrants from Philippines ($108,471, a difference of 0.080%), Immigrants from Lebanon ($108,471, a difference of 0.080%), and Sri Lankan ($108,270, a difference of 0.10%).
| Demographics | Rating | Rank | Householder Income Ages 45 - 64 years |
| Immigrants | Afghanistan | 98.6 /100 | #85 | Exceptional $108,785 |
| Austrians | 98.5 /100 | #86 | Exceptional $108,692 |
| Tongans | 98.5 /100 | #87 | Exceptional $108,643 |
| Romanians | 98.5 /100 | #88 | Exceptional $108,609 |
| Ukrainians | 98.3 /100 | #89 | Exceptional $108,475 |
| Immigrants | Philippines | 98.3 /100 | #90 | Exceptional $108,471 |
| Immigrants | Lebanon | 98.3 /100 | #91 | Exceptional $108,471 |
| Croatians | 98.3 /100 | #92 | Exceptional $108,383 |
| Immigrants | Croatia | 98.2 /100 | #93 | Exceptional $108,304 |
| Sri Lankans | 98.2 /100 | #94 | Exceptional $108,270 |
| Immigrants | Hungary | 98.2 /100 | #95 | Exceptional $108,267 |
| Immigrants | Argentina | 98.2 /100 | #96 | Exceptional $108,264 |
| Northern Europeans | 97.8 /100 | #97 | Exceptional $107,870 |
| Immigrants | Southern Europe | 97.7 /100 | #98 | Exceptional $107,775 |
| Palestinians | 97.6 /100 | #99 | Exceptional $107,721 |