Inupiat vs West Indian Householder Income Ages 45 - 64 years
COMPARE
Inupiat
West Indian
Householder Income Ages 45 - 64 years
Householder Income Ages 45 - 64 years Comparison
Inupiat
West Indians
$91,355
HOUSEHOLDER INCOME AGES 45 - 64 YEARS
1.1/ 100
METRIC RATING
242nd/ 347
METRIC RANK
$89,906
HOUSEHOLDER INCOME AGES 45 - 64 YEARS
0.5/ 100
METRIC RATING
255th/ 347
METRIC RANK
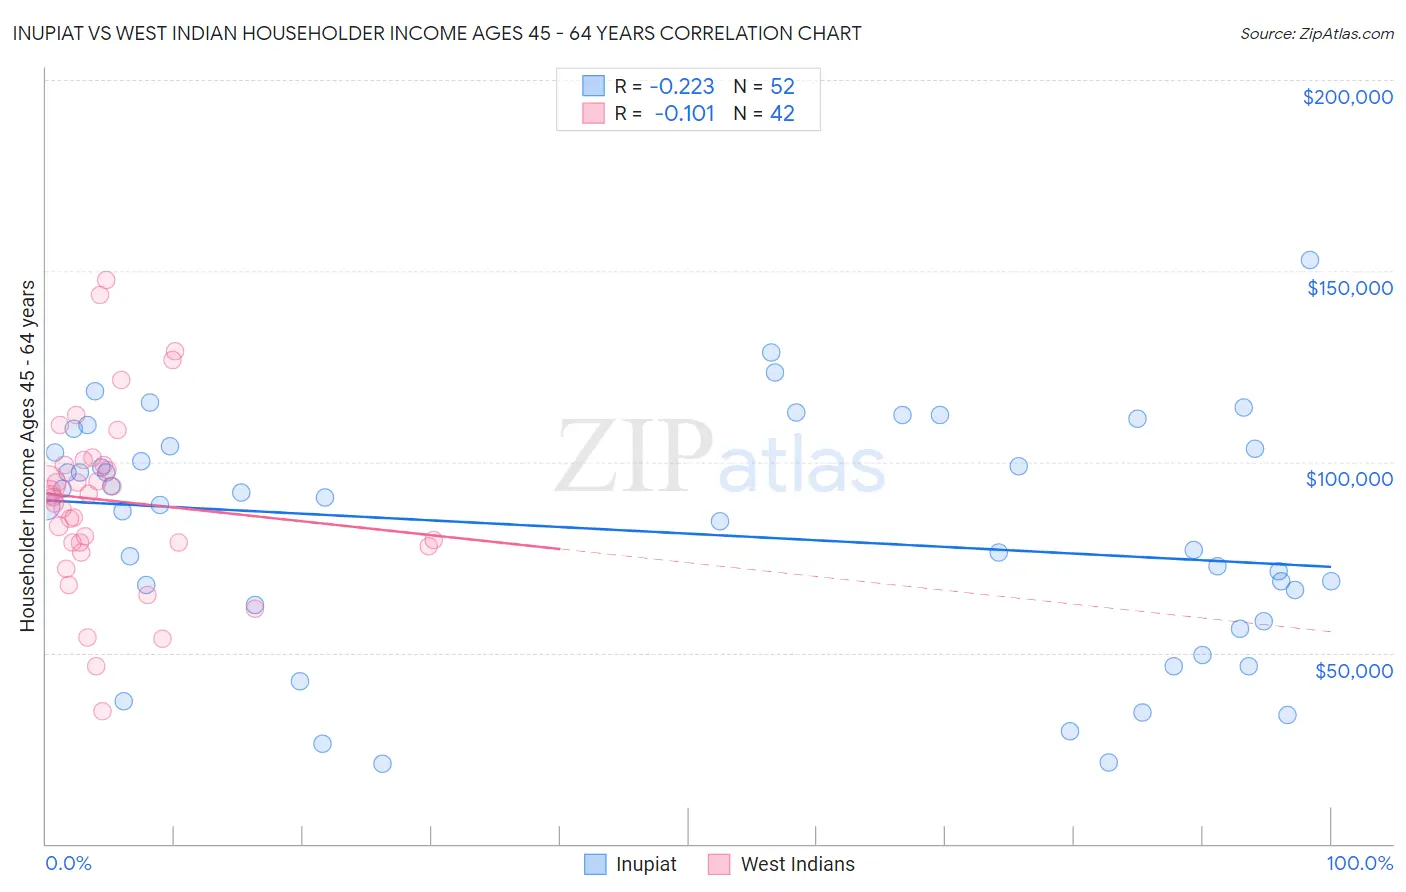
Inupiat vs West Indian Householder Income Ages 45 - 64 years Correlation Chart
The statistical analysis conducted on geographies consisting of 96,273,732 people shows a weak negative correlation between the proportion of Inupiat and household income with householder between the ages 45 and 64 in the United States with a correlation coefficient (R) of -0.223 and weighted average of $91,355. Similarly, the statistical analysis conducted on geographies consisting of 253,646,357 people shows a poor negative correlation between the proportion of West Indians and household income with householder between the ages 45 and 64 in the United States with a correlation coefficient (R) of -0.101 and weighted average of $89,906, a difference of 1.6%.
Householder Income Ages 45 - 64 years Correlation Summary
| Measurement | Inupiat | West Indian |
| Minimum | $20,833 | $34,699 |
| Maximum | $152,917 | $147,760 |
| Range | $132,084 | $113,061 |
| Mean | $81,669 | $89,808 |
| Median | $88,444 | $91,034 |
| Interquartile 25% (IQ1) | $60,416 | $78,920 |
| Interquartile 75% (IQ3) | $103,725 | $99,241 |
| Interquartile Range (IQR) | $43,309 | $20,321 |
| Standard Deviation (Sample) | $30,923 | $23,506 |
| Standard Deviation (Population) | $30,625 | $23,224 |
Demographics Similar to Inupiat and West Indians by Householder Income Ages 45 - 64 years
In terms of householder income ages 45 - 64 years, the demographic groups most similar to Inupiat are Trinidadian and Tobagonian ($91,357, a difference of 0.0%), Immigrants from Trinidad and Tobago ($91,347, a difference of 0.010%), Immigrants from Burma/Myanmar ($91,385, a difference of 0.030%), Immigrants from Middle Africa ($91,293, a difference of 0.070%), and Immigrants from Ecuador ($91,462, a difference of 0.12%). Similarly, the demographic groups most similar to West Indians are French American Indian ($89,811, a difference of 0.11%), Immigrants from Guyana ($90,186, a difference of 0.31%), Barbadian ($90,266, a difference of 0.40%), German Russian ($89,398, a difference of 0.57%), and Immigrants from Barbados ($89,394, a difference of 0.57%).
| Demographics | Rating | Rank | Householder Income Ages 45 - 64 years |
| Pennsylvania Germans | 1.5 /100 | #238 | Tragic $91,956 |
| Immigrants | Ecuador | 1.2 /100 | #239 | Tragic $91,462 |
| Immigrants | Burma/Myanmar | 1.1 /100 | #240 | Tragic $91,385 |
| Trinidadians and Tobagonians | 1.1 /100 | #241 | Tragic $91,357 |
| Inupiat | 1.1 /100 | #242 | Tragic $91,355 |
| Immigrants | Trinidad and Tobago | 1.1 /100 | #243 | Tragic $91,347 |
| Immigrants | Middle Africa | 1.1 /100 | #244 | Tragic $91,293 |
| Guyanese | 0.9 /100 | #245 | Tragic $90,966 |
| Central Americans | 0.9 /100 | #246 | Tragic $90,951 |
| Alaskan Athabascans | 0.9 /100 | #247 | Tragic $90,951 |
| Immigrants | Laos | 0.9 /100 | #248 | Tragic $90,909 |
| Mexican American Indians | 0.8 /100 | #249 | Tragic $90,811 |
| Sub-Saharan Africans | 0.8 /100 | #250 | Tragic $90,691 |
| Americans | 0.7 /100 | #251 | Tragic $90,536 |
| Marshallese | 0.7 /100 | #252 | Tragic $90,455 |
| Barbadians | 0.6 /100 | #253 | Tragic $90,266 |
| Immigrants | Guyana | 0.6 /100 | #254 | Tragic $90,186 |
| West Indians | 0.5 /100 | #255 | Tragic $89,906 |
| French American Indians | 0.5 /100 | #256 | Tragic $89,811 |
| German Russians | 0.4 /100 | #257 | Tragic $89,398 |
| Immigrants | Barbados | 0.4 /100 | #258 | Tragic $89,394 |