Immigrants from Liberia vs West Indian 5th Grade
COMPARE
Immigrants from Liberia
West Indian
5th Grade
5th Grade Comparison
Immigrants from Liberia
West Indians
96.9%
5TH GRADE
1.0/ 100
METRIC RATING
250th/ 347
METRIC RANK
96.8%
5TH GRADE
0.3/ 100
METRIC RATING
264th/ 347
METRIC RANK
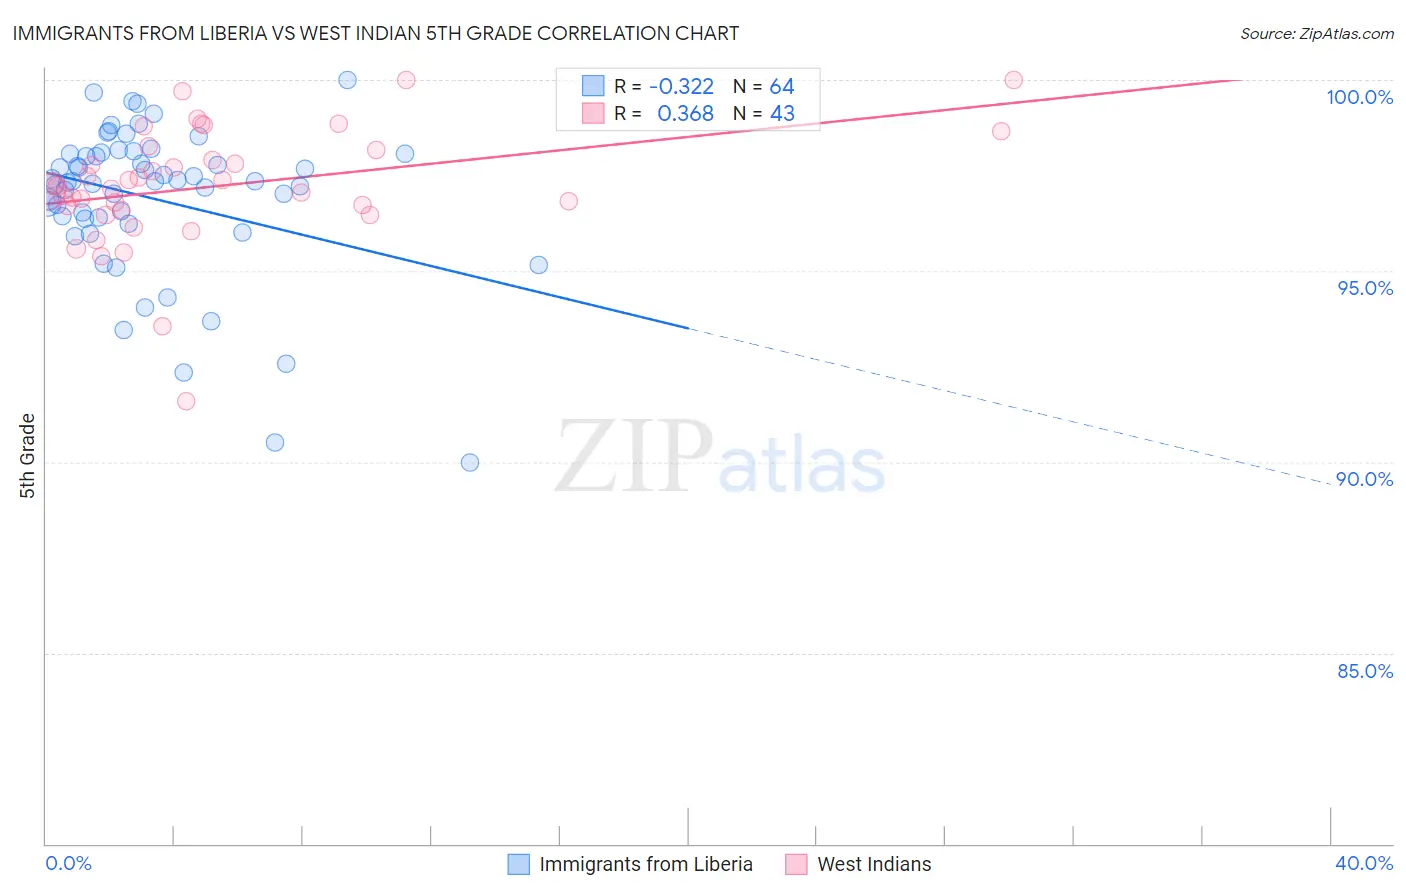
Immigrants from Liberia vs West Indian 5th Grade Correlation Chart
The statistical analysis conducted on geographies consisting of 135,294,272 people shows a mild negative correlation between the proportion of Immigrants from Liberia and percentage of population with at least 5th grade education in the United States with a correlation coefficient (R) of -0.322 and weighted average of 96.9%. Similarly, the statistical analysis conducted on geographies consisting of 254,059,006 people shows a mild positive correlation between the proportion of West Indians and percentage of population with at least 5th grade education in the United States with a correlation coefficient (R) of 0.368 and weighted average of 96.8%, a difference of 0.12%.
5th Grade Correlation Summary
| Measurement | Immigrants from Liberia | West Indian |
| Minimum | 90.0% | 91.6% |
| Maximum | 100.0% | 100.0% |
| Range | 10.0% | 8.4% |
| Mean | 96.9% | 97.2% |
| Median | 97.4% | 97.2% |
| Interquartile 25% (IQ1) | 96.4% | 96.6% |
| Interquartile 75% (IQ3) | 98.1% | 98.2% |
| Interquartile Range (IQR) | 1.7% | 1.6% |
| Standard Deviation (Sample) | 2.0% | 1.6% |
| Standard Deviation (Population) | 2.0% | 1.5% |
Demographics Similar to Immigrants from Liberia and West Indians by 5th Grade
In terms of 5th grade, the demographic groups most similar to Immigrants from Liberia are Immigrants from Uruguay (96.9%, a difference of 0.0%), Bolivian (96.9%, a difference of 0.0%), Immigrants from Africa (96.9%, a difference of 0.010%), U.S. Virgin Islander (96.9%, a difference of 0.010%), and Jamaican (96.9%, a difference of 0.010%). Similarly, the demographic groups most similar to West Indians are Taiwanese (96.7%, a difference of 0.0%), Immigrants from Colombia (96.8%, a difference of 0.010%), Immigrants from Uzbekistan (96.8%, a difference of 0.010%), Immigrants from Nigeria (96.7%, a difference of 0.010%), and Immigrants from South America (96.7%, a difference of 0.010%).
| Demographics | Rating | Rank | 5th Grade |
| Immigrants | Africa | 1.1 /100 | #247 | Tragic 96.9% |
| U.S. Virgin Islanders | 1.1 /100 | #248 | Tragic 96.9% |
| Immigrants | Uruguay | 1.0 /100 | #249 | Tragic 96.9% |
| Immigrants | Liberia | 1.0 /100 | #250 | Tragic 96.9% |
| Bolivians | 0.9 /100 | #251 | Tragic 96.9% |
| Jamaicans | 0.9 /100 | #252 | Tragic 96.9% |
| Immigrants | Middle Africa | 0.8 /100 | #253 | Tragic 96.8% |
| Immigrants | Senegal | 0.8 /100 | #254 | Tragic 96.8% |
| South Americans | 0.7 /100 | #255 | Tragic 96.8% |
| Immigrants | Congo | 0.7 /100 | #256 | Tragic 96.8% |
| Peruvians | 0.6 /100 | #257 | Tragic 96.8% |
| Immigrants | Ethiopia | 0.5 /100 | #258 | Tragic 96.8% |
| Immigrants | China | 0.5 /100 | #259 | Tragic 96.8% |
| Immigrants | Jamaica | 0.4 /100 | #260 | Tragic 96.8% |
| Immigrants | Sierra Leone | 0.4 /100 | #261 | Tragic 96.8% |
| Immigrants | Colombia | 0.4 /100 | #262 | Tragic 96.8% |
| Immigrants | Uzbekistan | 0.3 /100 | #263 | Tragic 96.8% |
| West Indians | 0.3 /100 | #264 | Tragic 96.8% |
| Taiwanese | 0.3 /100 | #265 | Tragic 96.7% |
| Immigrants | Nigeria | 0.3 /100 | #266 | Tragic 96.7% |
| Immigrants | South America | 0.3 /100 | #267 | Tragic 96.7% |