Hispanic or Latino vs West Indian Householder Income Ages 45 - 64 years
COMPARE
Hispanic or Latino
West Indian
Householder Income Ages 45 - 64 years
Householder Income Ages 45 - 64 years Comparison
Hispanics or Latinos
West Indians
$86,006
HOUSEHOLDER INCOME AGES 45 - 64 YEARS
0.1/ 100
METRIC RATING
291st/ 347
METRIC RANK
$89,906
HOUSEHOLDER INCOME AGES 45 - 64 YEARS
0.5/ 100
METRIC RATING
255th/ 347
METRIC RANK
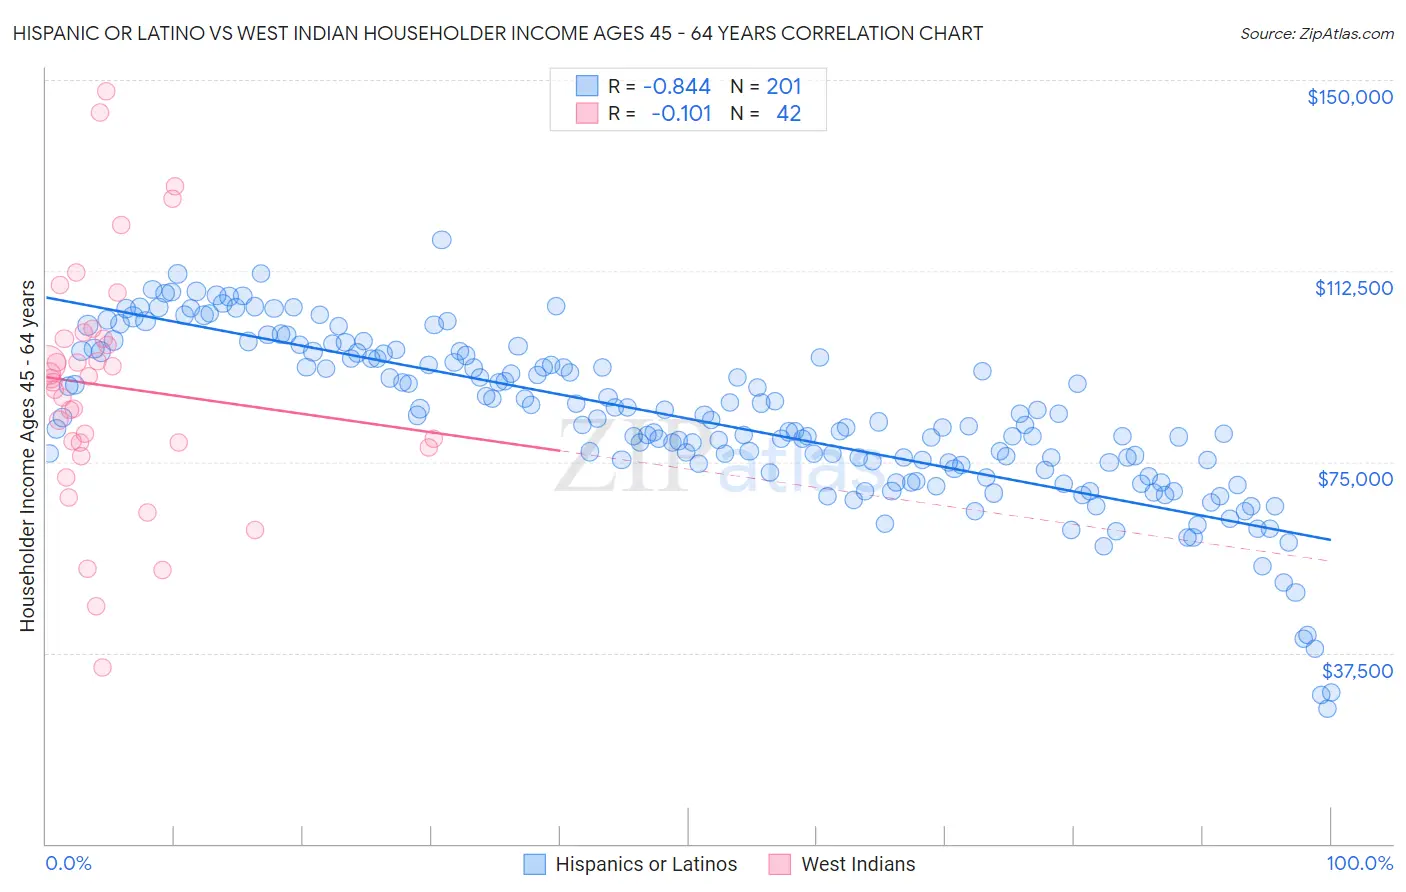
Hispanic or Latino vs West Indian Householder Income Ages 45 - 64 years Correlation Chart
The statistical analysis conducted on geographies consisting of 574,103,825 people shows a very strong negative correlation between the proportion of Hispanics or Latinos and household income with householder between the ages 45 and 64 in the United States with a correlation coefficient (R) of -0.844 and weighted average of $86,006. Similarly, the statistical analysis conducted on geographies consisting of 253,646,357 people shows a poor negative correlation between the proportion of West Indians and household income with householder between the ages 45 and 64 in the United States with a correlation coefficient (R) of -0.101 and weighted average of $89,906, a difference of 4.5%.
Householder Income Ages 45 - 64 years Correlation Summary
| Measurement | Hispanic or Latino | West Indian |
| Minimum | $26,626 | $34,699 |
| Maximum | $118,670 | $147,760 |
| Range | $92,045 | $113,061 |
| Mean | $83,367 | $89,808 |
| Median | $82,863 | $91,034 |
| Interquartile 25% (IQ1) | $74,106 | $78,920 |
| Interquartile 75% (IQ3) | $96,088 | $99,241 |
| Interquartile Range (IQR) | $21,982 | $20,321 |
| Standard Deviation (Sample) | $16,403 | $23,506 |
| Standard Deviation (Population) | $16,362 | $23,224 |
Similar Demographics by Householder Income Ages 45 - 64 years
Demographics Similar to Hispanics or Latinos by Householder Income Ages 45 - 64 years
In terms of householder income ages 45 - 64 years, the demographic groups most similar to Hispanics or Latinos are Immigrants from Central America ($85,965, a difference of 0.050%), Cherokee ($86,125, a difference of 0.14%), Comanche ($85,787, a difference of 0.25%), Cuban ($86,301, a difference of 0.34%), and Immigrants from St. Vincent and the Grenadines ($86,394, a difference of 0.45%).
| Demographics | Rating | Rank | Householder Income Ages 45 - 64 years |
| Central American Indians | 0.1 /100 | #284 | Tragic $86,764 |
| Blackfeet | 0.1 /100 | #285 | Tragic $86,595 |
| Immigrants | Guatemala | 0.1 /100 | #286 | Tragic $86,573 |
| Bangladeshis | 0.1 /100 | #287 | Tragic $86,402 |
| Immigrants | St. Vincent and the Grenadines | 0.1 /100 | #288 | Tragic $86,394 |
| Cubans | 0.1 /100 | #289 | Tragic $86,301 |
| Cherokee | 0.1 /100 | #290 | Tragic $86,125 |
| Hispanics or Latinos | 0.1 /100 | #291 | Tragic $86,006 |
| Immigrants | Central America | 0.1 /100 | #292 | Tragic $85,965 |
| Comanche | 0.1 /100 | #293 | Tragic $85,787 |
| British West Indians | 0.1 /100 | #294 | Tragic $85,571 |
| Immigrants | Grenada | 0.1 /100 | #295 | Tragic $85,552 |
| Immigrants | Zaire | 0.1 /100 | #296 | Tragic $85,207 |
| Fijians | 0.1 /100 | #297 | Tragic $85,187 |
| Africans | 0.0 /100 | #298 | Tragic $84,925 |
Demographics Similar to West Indians by Householder Income Ages 45 - 64 years
In terms of householder income ages 45 - 64 years, the demographic groups most similar to West Indians are French American Indian ($89,811, a difference of 0.11%), Immigrants from Guyana ($90,186, a difference of 0.31%), Barbadian ($90,266, a difference of 0.40%), German Russian ($89,398, a difference of 0.57%), and Immigrants from Barbados ($89,394, a difference of 0.57%).
| Demographics | Rating | Rank | Householder Income Ages 45 - 64 years |
| Immigrants | Laos | 0.9 /100 | #248 | Tragic $90,909 |
| Mexican American Indians | 0.8 /100 | #249 | Tragic $90,811 |
| Sub-Saharan Africans | 0.8 /100 | #250 | Tragic $90,691 |
| Americans | 0.7 /100 | #251 | Tragic $90,536 |
| Marshallese | 0.7 /100 | #252 | Tragic $90,455 |
| Barbadians | 0.6 /100 | #253 | Tragic $90,266 |
| Immigrants | Guyana | 0.6 /100 | #254 | Tragic $90,186 |
| West Indians | 0.5 /100 | #255 | Tragic $89,906 |
| French American Indians | 0.5 /100 | #256 | Tragic $89,811 |
| German Russians | 0.4 /100 | #257 | Tragic $89,398 |
| Immigrants | Barbados | 0.4 /100 | #258 | Tragic $89,394 |
| Immigrants | Nicaragua | 0.4 /100 | #259 | Tragic $89,108 |
| Liberians | 0.3 /100 | #260 | Tragic $88,929 |
| Belizeans | 0.3 /100 | #261 | Tragic $88,684 |
| Somalis | 0.3 /100 | #262 | Tragic $88,600 |