Jamaican vs Nicaraguan Median Earnings
COMPARE
Jamaican
Nicaraguan
Median Earnings
Median Earnings Comparison
Jamaicans
Nicaraguans
$43,343
MEDIAN EARNINGS
1.3/ 100
METRIC RATING
257th/ 347
METRIC RANK
$43,026
MEDIAN EARNINGS
0.8/ 100
METRIC RATING
262nd/ 347
METRIC RANK
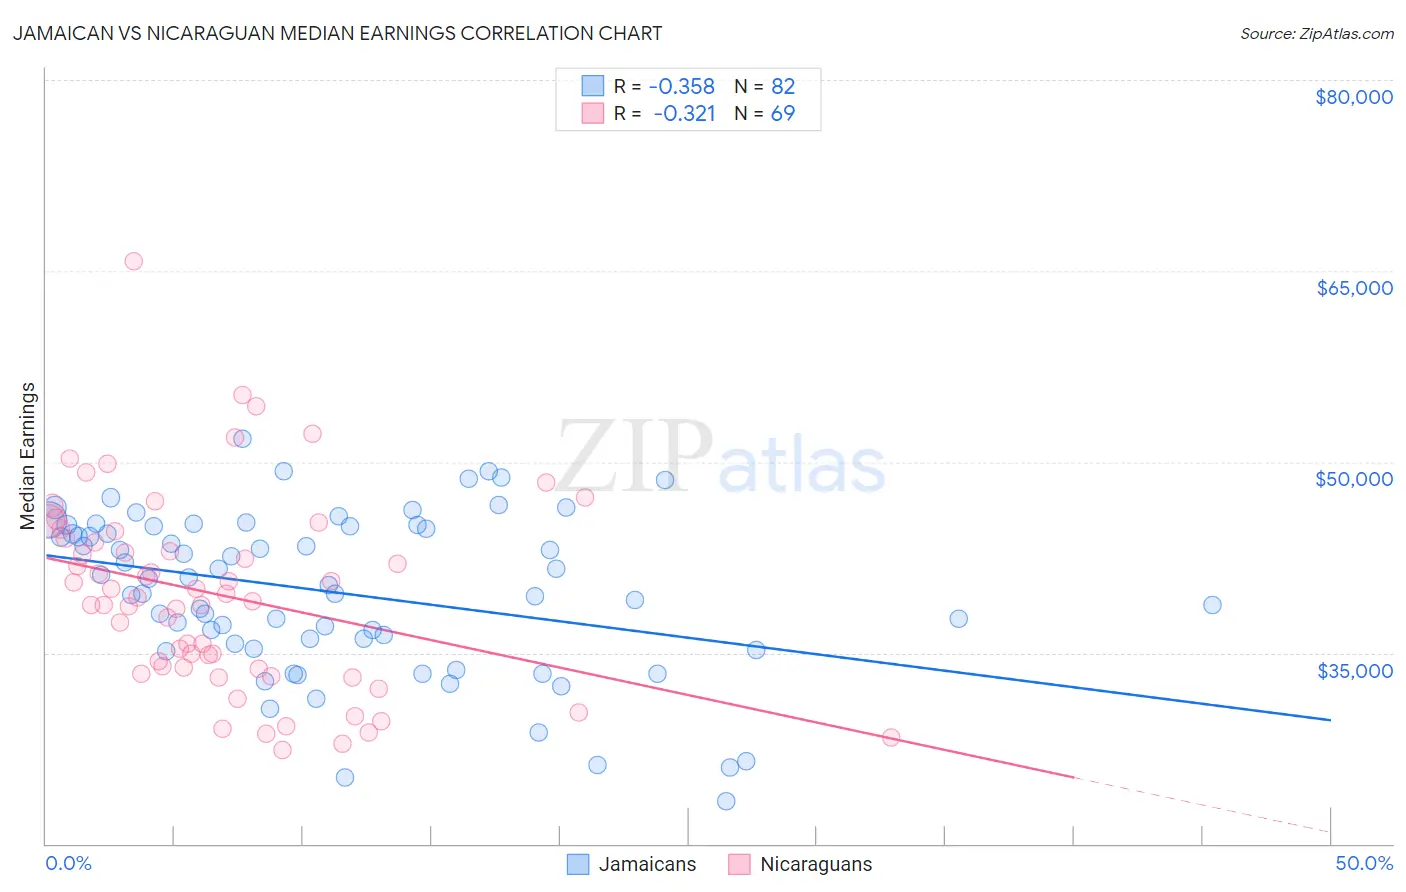
Jamaican vs Nicaraguan Median Earnings Correlation Chart
The statistical analysis conducted on geographies consisting of 368,067,864 people shows a mild negative correlation between the proportion of Jamaicans and median earnings in the United States with a correlation coefficient (R) of -0.358 and weighted average of $43,343. Similarly, the statistical analysis conducted on geographies consisting of 285,714,618 people shows a mild negative correlation between the proportion of Nicaraguans and median earnings in the United States with a correlation coefficient (R) of -0.321 and weighted average of $43,026, a difference of 0.74%.
Median Earnings Correlation Summary
| Measurement | Jamaican | Nicaraguan |
| Minimum | $23,316 | $27,330 |
| Maximum | $51,789 | $65,764 |
| Range | $28,473 | $38,434 |
| Mean | $39,739 | $39,567 |
| Median | $40,605 | $39,352 |
| Interquartile 25% (IQ1) | $35,749 | $33,795 |
| Interquartile 75% (IQ3) | $44,901 | $44,292 |
| Interquartile Range (IQR) | $9,152 | $10,497 |
| Standard Deviation (Sample) | $6,295 | $7,612 |
| Standard Deviation (Population) | $6,257 | $7,557 |
Demographics Similar to Jamaicans and Nicaraguans by Median Earnings
In terms of median earnings, the demographic groups most similar to Jamaicans are French American Indian ($43,333, a difference of 0.020%), Alaskan Athabascan ($43,393, a difference of 0.12%), Immigrants from Middle Africa ($43,416, a difference of 0.17%), German Russian ($43,200, a difference of 0.33%), and Liberian ($43,536, a difference of 0.45%). Similarly, the demographic groups most similar to Nicaraguans are Immigrants from Jamaica ($43,026, a difference of 0.0%), Inupiat ($43,000, a difference of 0.060%), Immigrants from Somalia ($43,100, a difference of 0.17%), Immigrants from Liberia ($42,923, a difference of 0.24%), and Salvadoran ($42,912, a difference of 0.27%).
| Demographics | Rating | Rank | Median Earnings |
| Malaysians | 2.6 /100 | #249 | Tragic $43,844 |
| Alaska Natives | 2.3 /100 | #250 | Tragic $43,750 |
| Tsimshian | 2.1 /100 | #251 | Tragic $43,695 |
| Hawaiians | 2.0 /100 | #252 | Tragic $43,673 |
| Somalis | 1.8 /100 | #253 | Tragic $43,567 |
| Liberians | 1.7 /100 | #254 | Tragic $43,536 |
| Immigrants | Middle Africa | 1.4 /100 | #255 | Tragic $43,416 |
| Alaskan Athabascans | 1.4 /100 | #256 | Tragic $43,393 |
| Jamaicans | 1.3 /100 | #257 | Tragic $43,343 |
| French American Indians | 1.3 /100 | #258 | Tragic $43,333 |
| German Russians | 1.1 /100 | #259 | Tragic $43,200 |
| Immigrants | Somalia | 0.9 /100 | #260 | Tragic $43,100 |
| Immigrants | Jamaica | 0.8 /100 | #261 | Tragic $43,026 |
| Nicaraguans | 0.8 /100 | #262 | Tragic $43,026 |
| Inupiat | 0.8 /100 | #263 | Tragic $43,000 |
| Immigrants | Liberia | 0.7 /100 | #264 | Tragic $42,923 |
| Salvadorans | 0.7 /100 | #265 | Tragic $42,912 |
| Immigrants | Laos | 0.7 /100 | #266 | Tragic $42,884 |
| Cree | 0.6 /100 | #267 | Tragic $42,777 |
| Americans | 0.6 /100 | #268 | Tragic $42,742 |
| Belizeans | 0.5 /100 | #269 | Tragic $42,702 |