Immigrants from Middle Africa vs Immigrants from Ecuador Median Earnings
COMPARE
Immigrants from Middle Africa
Immigrants from Ecuador
Median Earnings
Median Earnings Comparison
Immigrants from Middle Africa
Immigrants from Ecuador
$43,416
MEDIAN EARNINGS
1.4/ 100
METRIC RATING
255th/ 347
METRIC RANK
$44,462
MEDIAN EARNINGS
5.9/ 100
METRIC RATING
237th/ 347
METRIC RANK
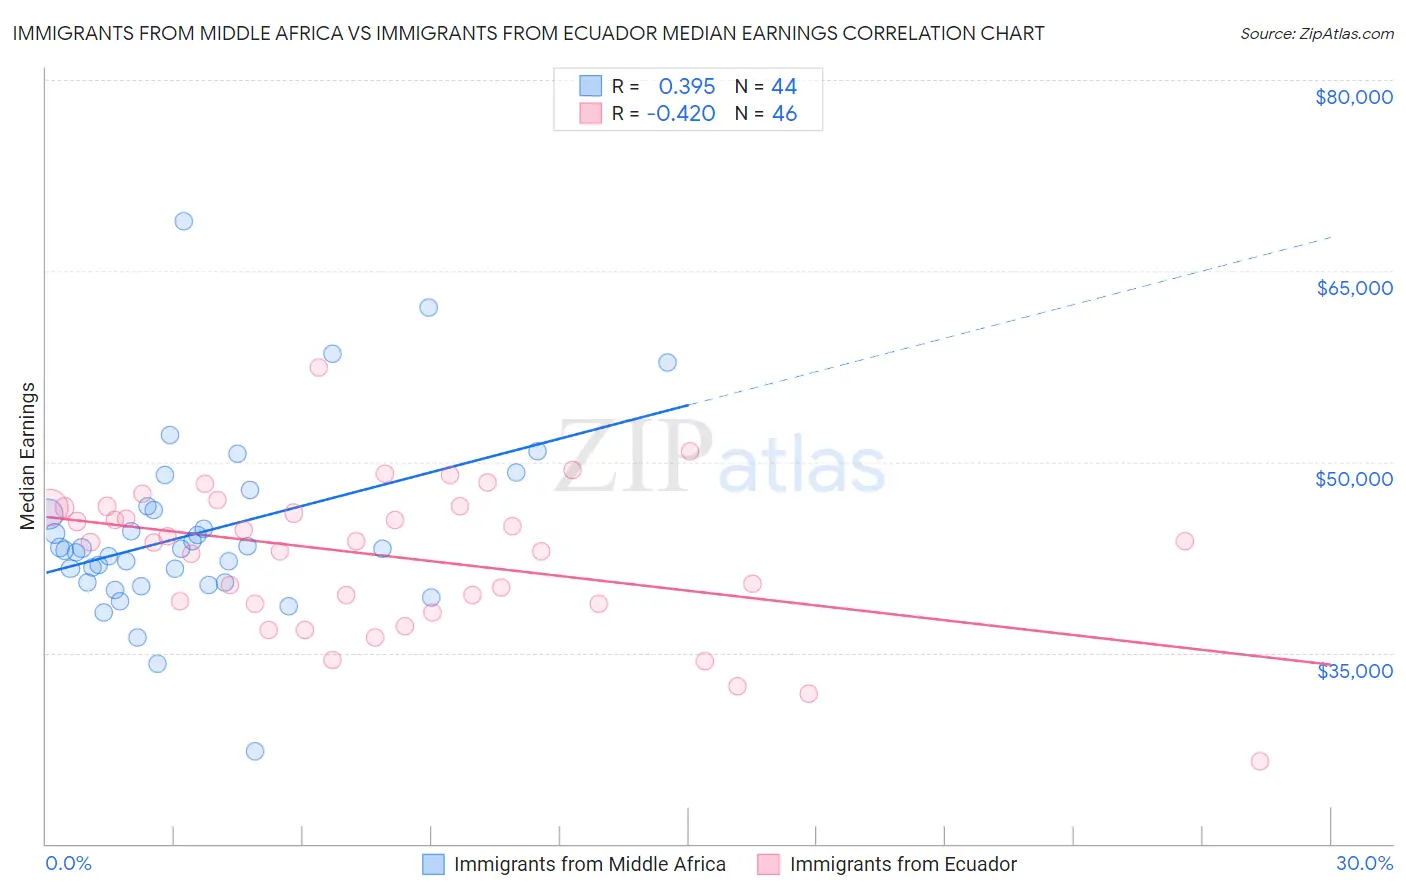
Immigrants from Middle Africa vs Immigrants from Ecuador Median Earnings Correlation Chart
The statistical analysis conducted on geographies consisting of 202,728,521 people shows a mild positive correlation between the proportion of Immigrants from Middle Africa and median earnings in the United States with a correlation coefficient (R) of 0.395 and weighted average of $43,416. Similarly, the statistical analysis conducted on geographies consisting of 271,003,938 people shows a moderate negative correlation between the proportion of Immigrants from Ecuador and median earnings in the United States with a correlation coefficient (R) of -0.420 and weighted average of $44,462, a difference of 2.4%.
Median Earnings Correlation Summary
| Measurement | Immigrants from Middle Africa | Immigrants from Ecuador |
| Minimum | $27,307 | $26,500 |
| Maximum | $68,894 | $57,428 |
| Range | $41,587 | $30,928 |
| Mean | $44,490 | $42,586 |
| Median | $43,158 | $43,711 |
| Interquartile 25% (IQ1) | $40,556 | $38,859 |
| Interquartile 75% (IQ3) | $46,358 | $46,439 |
| Interquartile Range (IQR) | $5,802 | $7,579 |
| Standard Deviation (Sample) | $7,197 | $5,767 |
| Standard Deviation (Population) | $7,115 | $5,704 |
Demographics Similar to Immigrants from Middle Africa and Immigrants from Ecuador by Median Earnings
In terms of median earnings, the demographic groups most similar to Immigrants from Middle Africa are Alaskan Athabascan ($43,393, a difference of 0.050%), Liberian ($43,536, a difference of 0.28%), Somali ($43,567, a difference of 0.35%), Hawaiian ($43,673, a difference of 0.59%), and Tsimshian ($43,695, a difference of 0.64%). Similarly, the demographic groups most similar to Immigrants from Ecuador are Sudanese ($44,419, a difference of 0.10%), British West Indian ($44,552, a difference of 0.20%), Senegalese ($44,373, a difference of 0.20%), Aleut ($44,241, a difference of 0.50%), and Samoan ($44,206, a difference of 0.58%).
| Demographics | Rating | Rank | Median Earnings |
| British West Indians | 6.7 /100 | #236 | Tragic $44,552 |
| Immigrants | Ecuador | 5.9 /100 | #237 | Tragic $44,462 |
| Sudanese | 5.6 /100 | #238 | Tragic $44,419 |
| Senegalese | 5.3 /100 | #239 | Tragic $44,373 |
| Aleuts | 4.4 /100 | #240 | Tragic $44,241 |
| Samoans | 4.2 /100 | #241 | Tragic $44,206 |
| Immigrants | Venezuela | 4.0 /100 | #242 | Tragic $44,163 |
| Sub-Saharan Africans | 3.7 /100 | #243 | Tragic $44,118 |
| Immigrants | Nonimmigrants | 3.7 /100 | #244 | Tragic $44,117 |
| Immigrants | Burma/Myanmar | 3.2 /100 | #245 | Tragic $43,998 |
| Immigrants | West Indies | 3.1 /100 | #246 | Tragic $43,989 |
| Immigrants | Cabo Verde | 3.0 /100 | #247 | Tragic $43,963 |
| Nepalese | 2.6 /100 | #248 | Tragic $43,860 |
| Malaysians | 2.6 /100 | #249 | Tragic $43,844 |
| Alaska Natives | 2.3 /100 | #250 | Tragic $43,750 |
| Tsimshian | 2.1 /100 | #251 | Tragic $43,695 |
| Hawaiians | 2.0 /100 | #252 | Tragic $43,673 |
| Somalis | 1.8 /100 | #253 | Tragic $43,567 |
| Liberians | 1.7 /100 | #254 | Tragic $43,536 |
| Immigrants | Middle Africa | 1.4 /100 | #255 | Tragic $43,416 |
| Alaskan Athabascans | 1.4 /100 | #256 | Tragic $43,393 |