Immigrants from Latin America vs Immigrants from Cuba Median Family Income
COMPARE
Immigrants from Latin America
Immigrants from Cuba
Median Family Income
Median Family Income Comparison
Immigrants from Latin America
Immigrants from Cuba
$86,989
MEDIAN FAMILY INCOME
0.0/ 100
METRIC RATING
298th/ 347
METRIC RANK
$78,249
MEDIAN FAMILY INCOME
0.0/ 100
METRIC RATING
336th/ 347
METRIC RANK
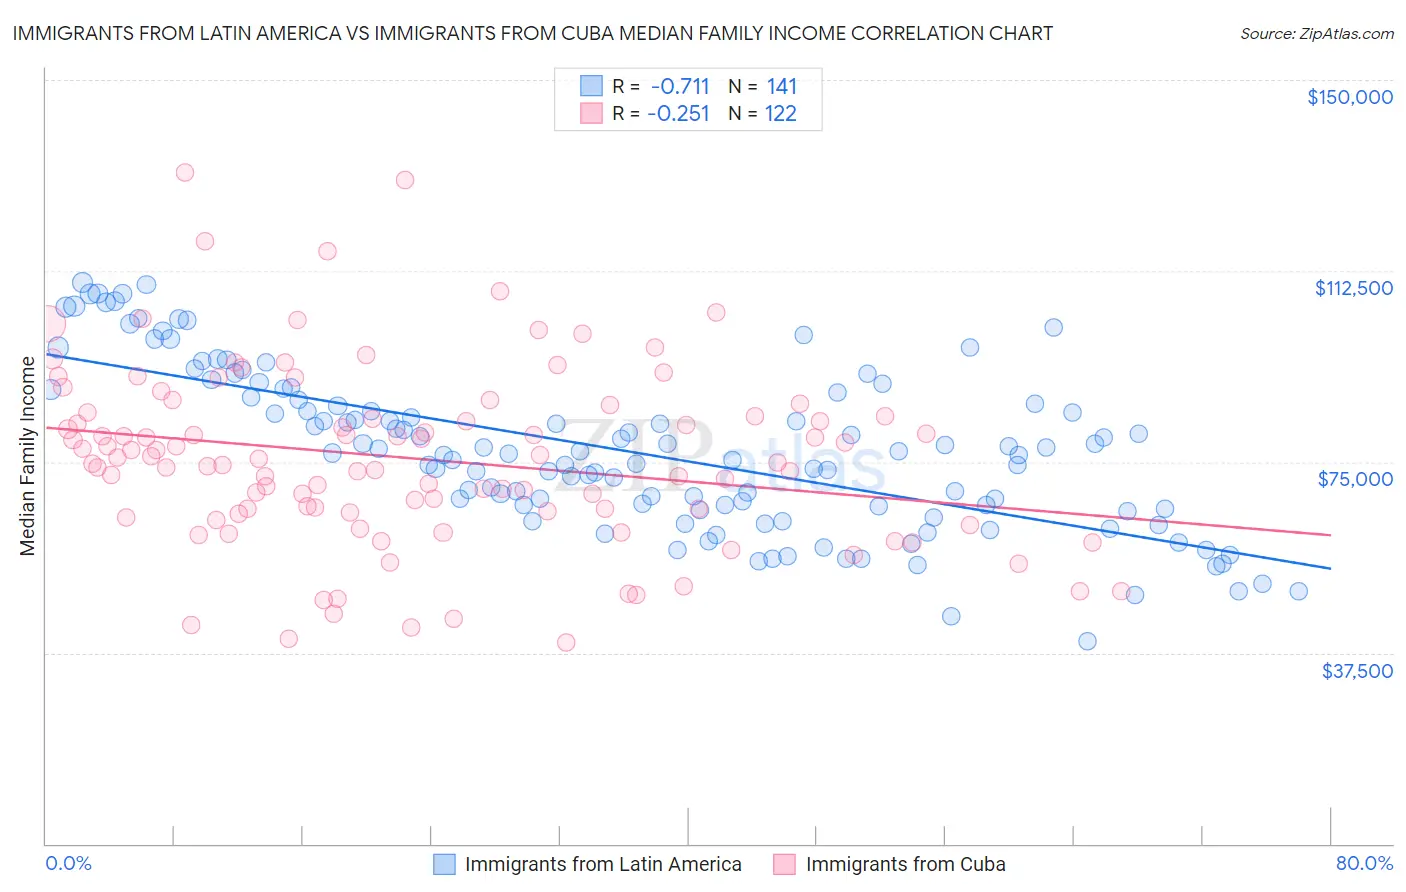
Immigrants from Latin America vs Immigrants from Cuba Median Family Income Correlation Chart
The statistical analysis conducted on geographies consisting of 557,337,898 people shows a strong negative correlation between the proportion of Immigrants from Latin America and median family income in the United States with a correlation coefficient (R) of -0.711 and weighted average of $86,989. Similarly, the statistical analysis conducted on geographies consisting of 325,826,414 people shows a weak negative correlation between the proportion of Immigrants from Cuba and median family income in the United States with a correlation coefficient (R) of -0.251 and weighted average of $78,249, a difference of 11.2%.
Median Family Income Correlation Summary
| Measurement | Immigrants from Latin America | Immigrants from Cuba |
| Minimum | $39,785 | $39,559 |
| Maximum | $110,302 | $131,935 |
| Range | $70,517 | $92,376 |
| Mean | $77,259 | $75,634 |
| Median | $76,749 | $75,235 |
| Interquartile 25% (IQ1) | $66,005 | $64,988 |
| Interquartile 75% (IQ3) | $88,129 | $83,903 |
| Interquartile Range (IQR) | $22,124 | $18,915 |
| Standard Deviation (Sample) | $15,813 | $17,632 |
| Standard Deviation (Population) | $15,756 | $17,559 |
Similar Demographics by Median Family Income
Demographics Similar to Immigrants from Latin America by Median Family Income
In terms of median family income, the demographic groups most similar to Immigrants from Latin America are Chippewa ($86,852, a difference of 0.16%), Cajun ($87,157, a difference of 0.19%), Immigrants from Guatemala ($87,191, a difference of 0.23%), Yaqui ($87,289, a difference of 0.34%), and Fijian ($87,387, a difference of 0.46%).
| Demographics | Rating | Rank | Median Family Income |
| Immigrants | Cabo Verde | 0.1 /100 | #291 | Tragic $87,830 |
| Africans | 0.1 /100 | #292 | Tragic $87,820 |
| Ute | 0.0 /100 | #293 | Tragic $87,596 |
| Fijians | 0.0 /100 | #294 | Tragic $87,387 |
| Yaqui | 0.0 /100 | #295 | Tragic $87,289 |
| Immigrants | Guatemala | 0.0 /100 | #296 | Tragic $87,191 |
| Cajuns | 0.0 /100 | #297 | Tragic $87,157 |
| Immigrants | Latin America | 0.0 /100 | #298 | Tragic $86,989 |
| Chippewa | 0.0 /100 | #299 | Tragic $86,852 |
| Ottawa | 0.0 /100 | #300 | Tragic $86,380 |
| Colville | 0.0 /100 | #301 | Tragic $85,792 |
| Spanish American Indians | 0.0 /100 | #302 | Tragic $85,728 |
| Hispanics or Latinos | 0.0 /100 | #303 | Tragic $85,647 |
| Mexicans | 0.0 /100 | #304 | Tragic $85,618 |
| Paiute | 0.0 /100 | #305 | Tragic $85,414 |
Demographics Similar to Immigrants from Cuba by Median Family Income
In terms of median family income, the demographic groups most similar to Immigrants from Cuba are Yuman ($78,055, a difference of 0.25%), Immigrants from Yemen ($77,457, a difference of 1.0%), Pima ($77,431, a difference of 1.1%), Yup'ik ($79,290, a difference of 1.3%), and Hopi ($77,188, a difference of 1.4%).
| Demographics | Rating | Rank | Median Family Income |
| Dutch West Indians | 0.0 /100 | #329 | Tragic $81,852 |
| Cheyenne | 0.0 /100 | #330 | Tragic $81,385 |
| Immigrants | Dominican Republic | 0.0 /100 | #331 | Tragic $81,233 |
| Natives/Alaskans | 0.0 /100 | #332 | Tragic $80,908 |
| Kiowa | 0.0 /100 | #333 | Tragic $80,885 |
| Menominee | 0.0 /100 | #334 | Tragic $79,563 |
| Yup'ik | 0.0 /100 | #335 | Tragic $79,290 |
| Immigrants | Cuba | 0.0 /100 | #336 | Tragic $78,249 |
| Yuman | 0.0 /100 | #337 | Tragic $78,055 |
| Immigrants | Yemen | 0.0 /100 | #338 | Tragic $77,457 |
| Pima | 0.0 /100 | #339 | Tragic $77,431 |
| Hopi | 0.0 /100 | #340 | Tragic $77,188 |
| Pueblo | 0.0 /100 | #341 | Tragic $76,880 |
| Crow | 0.0 /100 | #342 | Tragic $76,605 |
| Houma | 0.0 /100 | #343 | Tragic $76,188 |