Immigrants from Latin America vs Choctaw Median Family Income
COMPARE
Immigrants from Latin America
Choctaw
Median Family Income
Median Family Income Comparison
Immigrants from Latin America
Choctaw
$86,989
MEDIAN FAMILY INCOME
0.0/ 100
METRIC RATING
298th/ 347
METRIC RANK
$84,835
MEDIAN FAMILY INCOME
0.0/ 100
METRIC RATING
313th/ 347
METRIC RANK
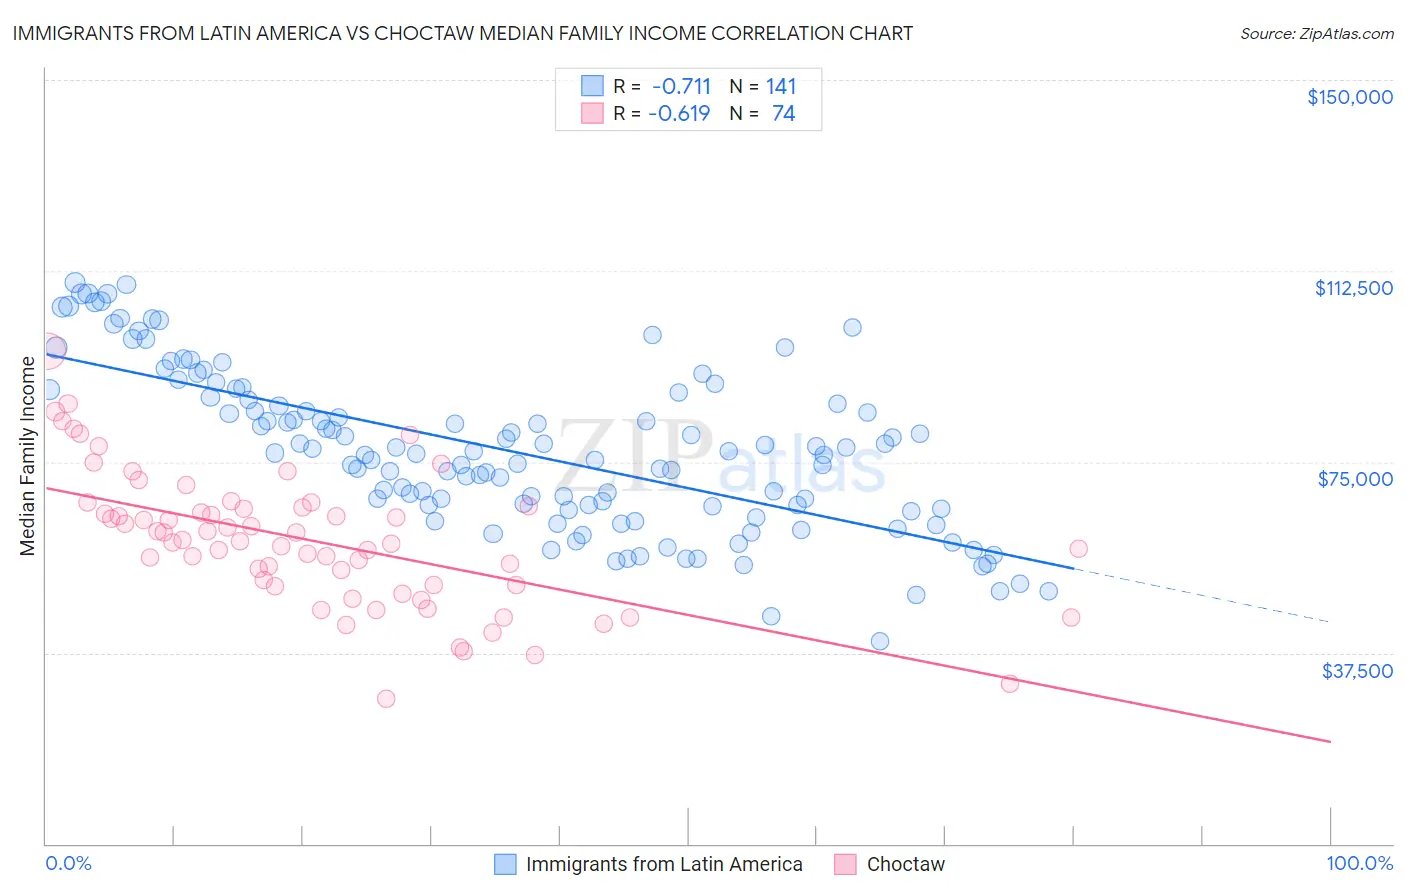
Immigrants from Latin America vs Choctaw Median Family Income Correlation Chart
The statistical analysis conducted on geographies consisting of 557,337,898 people shows a strong negative correlation between the proportion of Immigrants from Latin America and median family income in the United States with a correlation coefficient (R) of -0.711 and weighted average of $86,989. Similarly, the statistical analysis conducted on geographies consisting of 269,558,288 people shows a significant negative correlation between the proportion of Choctaw and median family income in the United States with a correlation coefficient (R) of -0.619 and weighted average of $84,835, a difference of 2.5%.
Median Family Income Correlation Summary
| Measurement | Immigrants from Latin America | Choctaw |
| Minimum | $39,785 | $28,571 |
| Maximum | $110,302 | $96,727 |
| Range | $70,517 | $68,156 |
| Mean | $77,259 | $59,567 |
| Median | $76,749 | $59,584 |
| Interquartile 25% (IQ1) | $66,005 | $50,833 |
| Interquartile 75% (IQ3) | $88,129 | $66,002 |
| Interquartile Range (IQR) | $22,124 | $15,169 |
| Standard Deviation (Sample) | $15,813 | $13,206 |
| Standard Deviation (Population) | $15,756 | $13,117 |
Demographics Similar to Immigrants from Latin America and Choctaw by Median Family Income
In terms of median family income, the demographic groups most similar to Immigrants from Latin America are Chippewa ($86,852, a difference of 0.16%), Cajun ($87,157, a difference of 0.19%), Immigrants from Guatemala ($87,191, a difference of 0.23%), Yaqui ($87,289, a difference of 0.34%), and Ottawa ($86,380, a difference of 0.71%). Similarly, the demographic groups most similar to Choctaw are Immigrants from Bahamas ($84,732, a difference of 0.12%), Cuban ($84,981, a difference of 0.17%), Honduran ($85,004, a difference of 0.20%), Immigrants from Central America ($85,050, a difference of 0.25%), and Haitian ($85,218, a difference of 0.45%).
| Demographics | Rating | Rank | Median Family Income |
| Yaqui | 0.0 /100 | #295 | Tragic $87,289 |
| Immigrants | Guatemala | 0.0 /100 | #296 | Tragic $87,191 |
| Cajuns | 0.0 /100 | #297 | Tragic $87,157 |
| Immigrants | Latin America | 0.0 /100 | #298 | Tragic $86,989 |
| Chippewa | 0.0 /100 | #299 | Tragic $86,852 |
| Ottawa | 0.0 /100 | #300 | Tragic $86,380 |
| Colville | 0.0 /100 | #301 | Tragic $85,792 |
| Spanish American Indians | 0.0 /100 | #302 | Tragic $85,728 |
| Hispanics or Latinos | 0.0 /100 | #303 | Tragic $85,647 |
| Mexicans | 0.0 /100 | #304 | Tragic $85,618 |
| Paiute | 0.0 /100 | #305 | Tragic $85,414 |
| Immigrants | Dominica | 0.0 /100 | #306 | Tragic $85,411 |
| Chickasaw | 0.0 /100 | #307 | Tragic $85,356 |
| U.S. Virgin Islanders | 0.0 /100 | #308 | Tragic $85,294 |
| Haitians | 0.0 /100 | #309 | Tragic $85,218 |
| Immigrants | Central America | 0.0 /100 | #310 | Tragic $85,050 |
| Hondurans | 0.0 /100 | #311 | Tragic $85,004 |
| Cubans | 0.0 /100 | #312 | Tragic $84,981 |
| Choctaw | 0.0 /100 | #313 | Tragic $84,835 |
| Immigrants | Bahamas | 0.0 /100 | #314 | Tragic $84,732 |
| Apache | 0.0 /100 | #315 | Tragic $84,451 |