Immigrants from Latin America vs Nicaraguan Median Family Income
COMPARE
Immigrants from Latin America
Nicaraguan
Median Family Income
Median Family Income Comparison
Immigrants from Latin America
Nicaraguans
$86,989
MEDIAN FAMILY INCOME
0.0/ 100
METRIC RATING
298th/ 347
METRIC RANK
$92,231
MEDIAN FAMILY INCOME
0.5/ 100
METRIC RATING
256th/ 347
METRIC RANK
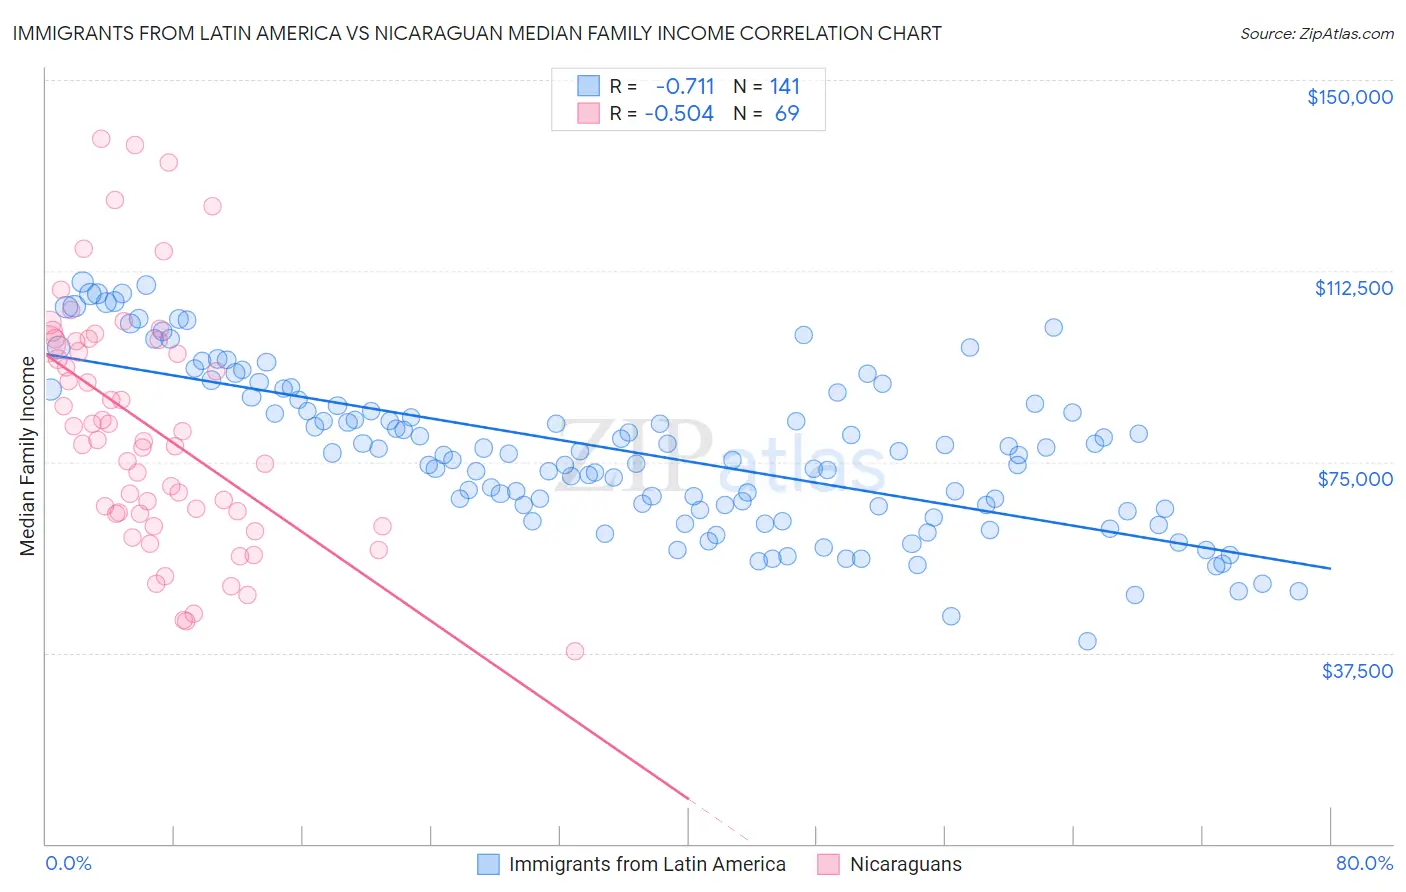
Immigrants from Latin America vs Nicaraguan Median Family Income Correlation Chart
The statistical analysis conducted on geographies consisting of 557,337,898 people shows a strong negative correlation between the proportion of Immigrants from Latin America and median family income in the United States with a correlation coefficient (R) of -0.711 and weighted average of $86,989. Similarly, the statistical analysis conducted on geographies consisting of 285,560,176 people shows a substantial negative correlation between the proportion of Nicaraguans and median family income in the United States with a correlation coefficient (R) of -0.504 and weighted average of $92,231, a difference of 6.0%.
Median Family Income Correlation Summary
| Measurement | Immigrants from Latin America | Nicaraguan |
| Minimum | $39,785 | $37,806 |
| Maximum | $110,302 | $138,531 |
| Range | $70,517 | $100,725 |
| Mean | $77,259 | $81,690 |
| Median | $76,749 | $79,377 |
| Interquartile 25% (IQ1) | $66,005 | $64,820 |
| Interquartile 75% (IQ3) | $88,129 | $98,783 |
| Interquartile Range (IQR) | $22,124 | $33,963 |
| Standard Deviation (Sample) | $15,813 | $23,577 |
| Standard Deviation (Population) | $15,756 | $23,406 |
Similar Demographics by Median Family Income
Demographics Similar to Immigrants from Latin America by Median Family Income
In terms of median family income, the demographic groups most similar to Immigrants from Latin America are Chippewa ($86,852, a difference of 0.16%), Cajun ($87,157, a difference of 0.19%), Immigrants from Guatemala ($87,191, a difference of 0.23%), Yaqui ($87,289, a difference of 0.34%), and Fijian ($87,387, a difference of 0.46%).
| Demographics | Rating | Rank | Median Family Income |
| Immigrants | Cabo Verde | 0.1 /100 | #291 | Tragic $87,830 |
| Africans | 0.1 /100 | #292 | Tragic $87,820 |
| Ute | 0.0 /100 | #293 | Tragic $87,596 |
| Fijians | 0.0 /100 | #294 | Tragic $87,387 |
| Yaqui | 0.0 /100 | #295 | Tragic $87,289 |
| Immigrants | Guatemala | 0.0 /100 | #296 | Tragic $87,191 |
| Cajuns | 0.0 /100 | #297 | Tragic $87,157 |
| Immigrants | Latin America | 0.0 /100 | #298 | Tragic $86,989 |
| Chippewa | 0.0 /100 | #299 | Tragic $86,852 |
| Ottawa | 0.0 /100 | #300 | Tragic $86,380 |
| Colville | 0.0 /100 | #301 | Tragic $85,792 |
| Spanish American Indians | 0.0 /100 | #302 | Tragic $85,728 |
| Hispanics or Latinos | 0.0 /100 | #303 | Tragic $85,647 |
| Mexicans | 0.0 /100 | #304 | Tragic $85,618 |
| Paiute | 0.0 /100 | #305 | Tragic $85,414 |
Demographics Similar to Nicaraguans by Median Family Income
In terms of median family income, the demographic groups most similar to Nicaraguans are Immigrants from Laos ($92,239, a difference of 0.010%), American ($92,096, a difference of 0.15%), Immigrants from Barbados ($92,419, a difference of 0.20%), Immigrants from Guyana ($92,513, a difference of 0.31%), and Osage ($91,926, a difference of 0.33%).
| Demographics | Rating | Rank | Median Family Income |
| Immigrants | Ecuador | 0.7 /100 | #249 | Tragic $92,837 |
| West Indians | 0.6 /100 | #250 | Tragic $92,765 |
| Immigrants | Somalia | 0.6 /100 | #251 | Tragic $92,609 |
| Immigrants | El Salvador | 0.6 /100 | #252 | Tragic $92,545 |
| Immigrants | Guyana | 0.6 /100 | #253 | Tragic $92,513 |
| Immigrants | Barbados | 0.5 /100 | #254 | Tragic $92,419 |
| Immigrants | Laos | 0.5 /100 | #255 | Tragic $92,239 |
| Nicaraguans | 0.5 /100 | #256 | Tragic $92,231 |
| Americans | 0.4 /100 | #257 | Tragic $92,096 |
| Osage | 0.4 /100 | #258 | Tragic $91,926 |
| Cape Verdeans | 0.4 /100 | #259 | Tragic $91,848 |
| Pennsylvania Germans | 0.4 /100 | #260 | Tragic $91,763 |
| Inupiat | 0.4 /100 | #261 | Tragic $91,730 |
| Liberians | 0.4 /100 | #262 | Tragic $91,722 |
| Immigrants | West Indies | 0.3 /100 | #263 | Tragic $91,588 |