Immigrants from Kuwait vs Taiwanese Householder Income Ages 45 - 64 years
COMPARE
Immigrants from Kuwait
Taiwanese
Householder Income Ages 45 - 64 years
Householder Income Ages 45 - 64 years Comparison
Immigrants from Kuwait
Taiwanese
$106,285
HOUSEHOLDER INCOME AGES 45 - 64 YEARS
95.2/ 100
METRIC RATING
115th/ 347
METRIC RANK
$104,180
HOUSEHOLDER INCOME AGES 45 - 64 YEARS
87.4/ 100
METRIC RATING
136th/ 347
METRIC RANK
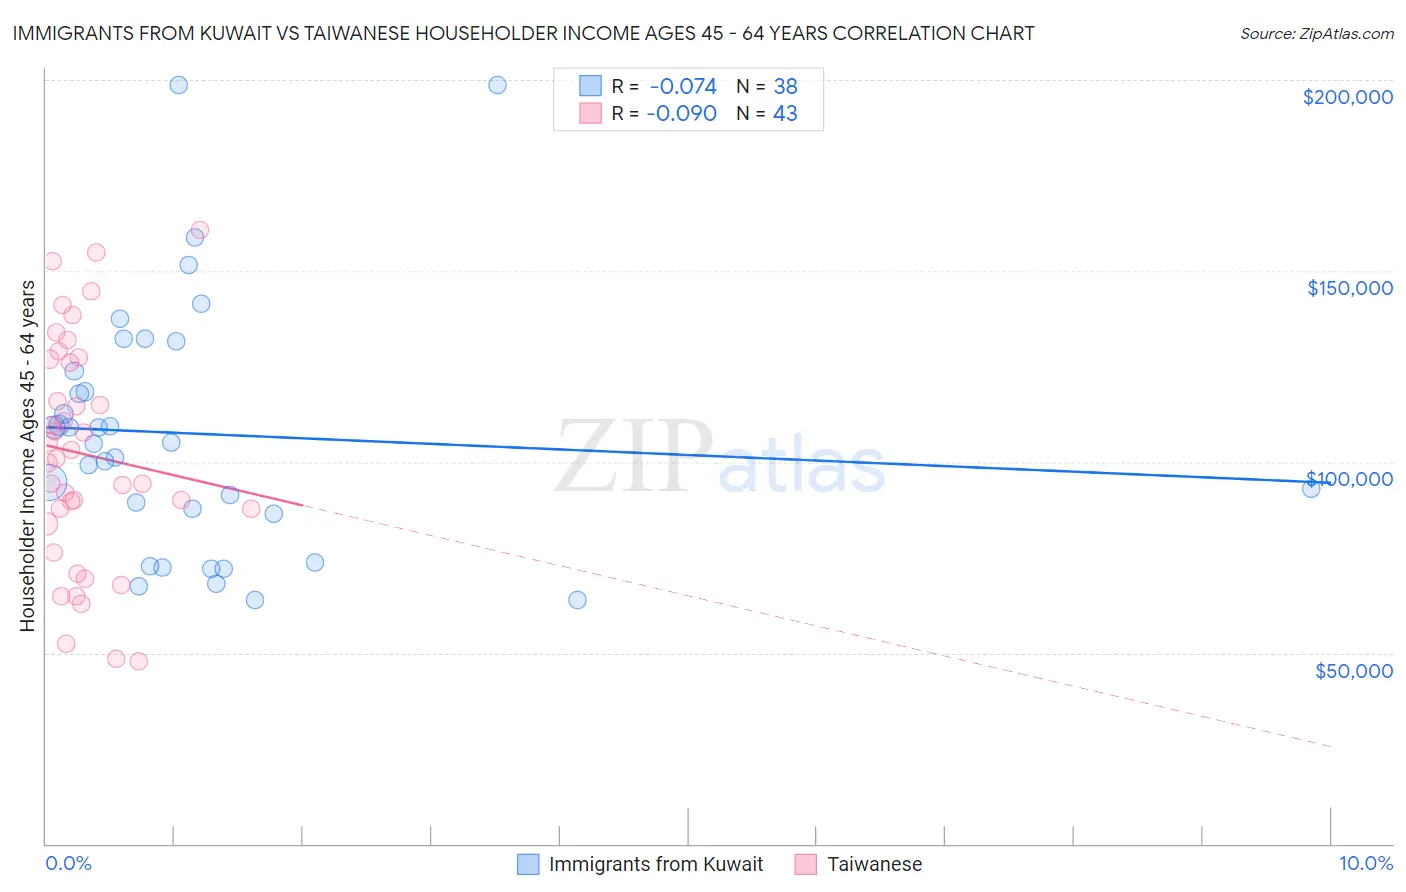
Immigrants from Kuwait vs Taiwanese Householder Income Ages 45 - 64 years Correlation Chart
The statistical analysis conducted on geographies consisting of 136,856,886 people shows a slight negative correlation between the proportion of Immigrants from Kuwait and household income with householder between the ages 45 and 64 in the United States with a correlation coefficient (R) of -0.074 and weighted average of $106,285. Similarly, the statistical analysis conducted on geographies consisting of 31,709,295 people shows a slight negative correlation between the proportion of Taiwanese and household income with householder between the ages 45 and 64 in the United States with a correlation coefficient (R) of -0.090 and weighted average of $104,180, a difference of 2.0%.
Householder Income Ages 45 - 64 years Correlation Summary
| Measurement | Immigrants from Kuwait | Taiwanese |
| Minimum | $63,767 | $47,813 |
| Maximum | $198,648 | $160,833 |
| Range | $134,881 | $113,020 |
| Mean | $107,348 | $102,027 |
| Median | $104,899 | $100,891 |
| Interquartile 25% (IQ1) | $86,528 | $83,846 |
| Interquartile 75% (IQ3) | $123,748 | $126,896 |
| Interquartile Range (IQR) | $37,220 | $43,050 |
| Standard Deviation (Sample) | $33,135 | $29,530 |
| Standard Deviation (Population) | $32,696 | $29,184 |
Similar Demographics by Householder Income Ages 45 - 64 years
Demographics Similar to Immigrants from Kuwait by Householder Income Ages 45 - 64 years
In terms of householder income ages 45 - 64 years, the demographic groups most similar to Immigrants from Kuwait are British ($106,264, a difference of 0.020%), Immigrants from Poland ($106,319, a difference of 0.030%), Albanian ($106,243, a difference of 0.040%), Immigrants from Western Asia ($106,217, a difference of 0.060%), and European ($106,367, a difference of 0.080%).
| Demographics | Rating | Rank | Householder Income Ages 45 - 64 years |
| Zimbabweans | 96.3 /100 | #108 | Exceptional $106,849 |
| Chileans | 95.9 /100 | #109 | Exceptional $106,611 |
| Immigrants | Brazil | 95.6 /100 | #110 | Exceptional $106,470 |
| Immigrants | Vietnam | 95.5 /100 | #111 | Exceptional $106,417 |
| Swedes | 95.4 /100 | #112 | Exceptional $106,377 |
| Europeans | 95.4 /100 | #113 | Exceptional $106,367 |
| Immigrants | Poland | 95.3 /100 | #114 | Exceptional $106,319 |
| Immigrants | Kuwait | 95.2 /100 | #115 | Exceptional $106,285 |
| British | 95.2 /100 | #116 | Exceptional $106,264 |
| Albanians | 95.1 /100 | #117 | Exceptional $106,243 |
| Immigrants | Western Asia | 95.0 /100 | #118 | Exceptional $106,217 |
| Immigrants | Jordan | 94.9 /100 | #119 | Exceptional $106,164 |
| Immigrants | South Eastern Asia | 94.8 /100 | #120 | Exceptional $106,109 |
| Poles | 94.4 /100 | #121 | Exceptional $105,952 |
| Immigrants | North Macedonia | 94.2 /100 | #122 | Exceptional $105,892 |
Demographics Similar to Taiwanese by Householder Income Ages 45 - 64 years
In terms of householder income ages 45 - 64 years, the demographic groups most similar to Taiwanese are Brazilian ($104,408, a difference of 0.22%), Hungarian ($103,913, a difference of 0.26%), Canadian ($104,560, a difference of 0.36%), Arab ($104,566, a difference of 0.37%), and Ethiopian ($103,736, a difference of 0.43%).
| Demographics | Rating | Rank | Householder Income Ages 45 - 64 years |
| Peruvians | 91.5 /100 | #129 | Exceptional $105,070 |
| Immigrants | Zimbabwe | 91.2 /100 | #130 | Exceptional $104,992 |
| Immigrants | Syria | 90.7 /100 | #131 | Exceptional $104,858 |
| Lebanese | 90.1 /100 | #132 | Exceptional $104,734 |
| Arabs | 89.3 /100 | #133 | Excellent $104,566 |
| Canadians | 89.3 /100 | #134 | Excellent $104,560 |
| Brazilians | 88.6 /100 | #135 | Excellent $104,408 |
| Taiwanese | 87.4 /100 | #136 | Excellent $104,180 |
| Hungarians | 85.8 /100 | #137 | Excellent $103,913 |
| Ethiopians | 84.7 /100 | #138 | Excellent $103,736 |
| Immigrants | Oceania | 84.5 /100 | #139 | Excellent $103,705 |
| Norwegians | 84.3 /100 | #140 | Excellent $103,682 |
| Immigrants | Uganda | 83.7 /100 | #141 | Excellent $103,584 |
| Luxembourgers | 83.3 /100 | #142 | Excellent $103,536 |
| Serbians | 83.2 /100 | #143 | Excellent $103,522 |