Immigrants from Kuwait vs Immigrants from Belarus Median Male Earnings
COMPARE
Immigrants from Kuwait
Immigrants from Belarus
Median Male Earnings
Median Male Earnings Comparison
Immigrants from Kuwait
Immigrants from Belarus
$57,562
MEDIAN MALE EARNINGS
95.3/ 100
METRIC RATING
114th/ 347
METRIC RANK
$62,658
MEDIAN MALE EARNINGS
100.0/ 100
METRIC RATING
43rd/ 347
METRIC RANK
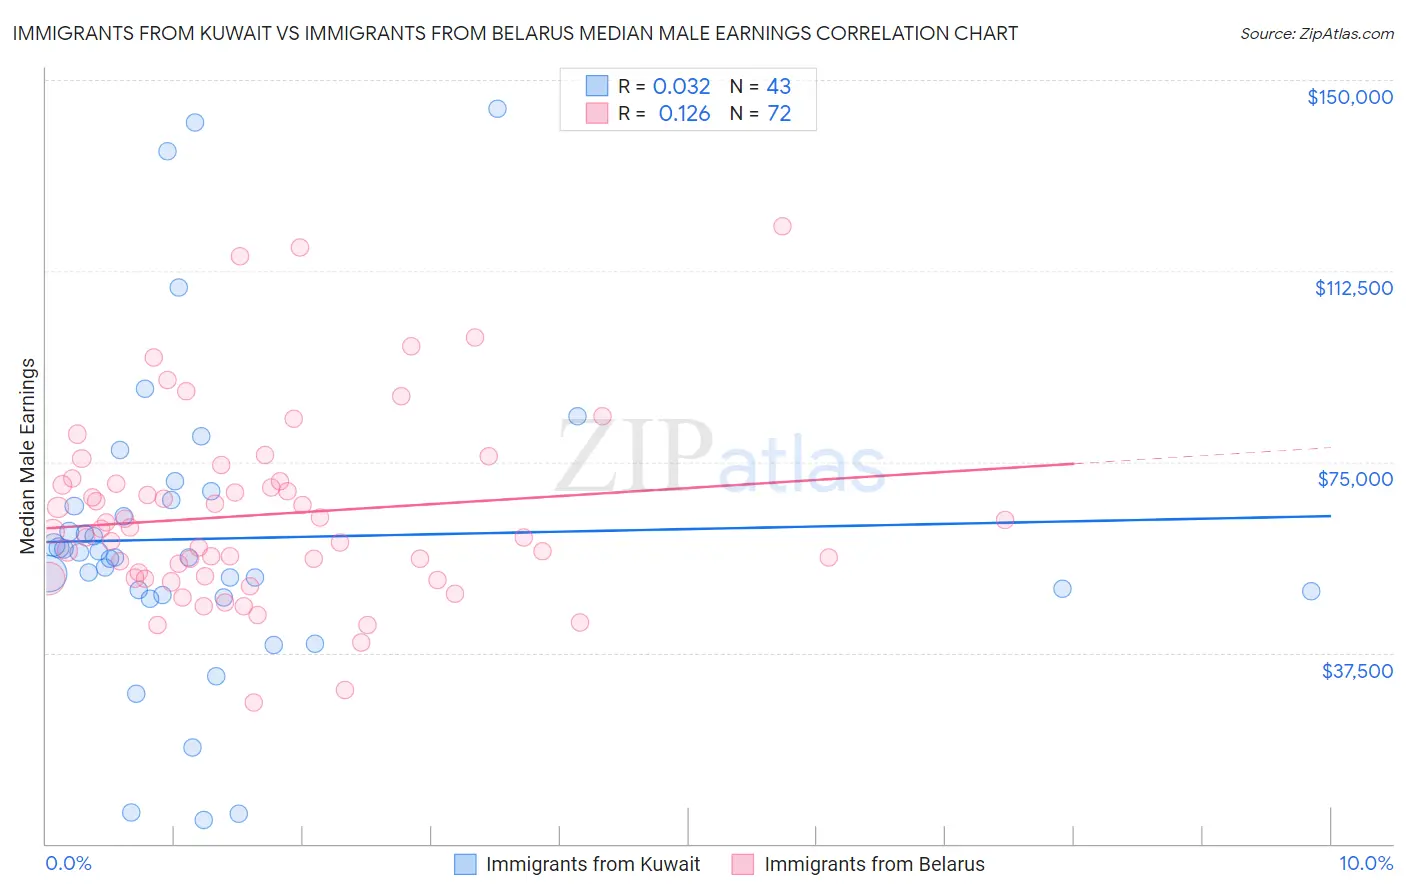
Immigrants from Kuwait vs Immigrants from Belarus Median Male Earnings Correlation Chart
The statistical analysis conducted on geographies consisting of 136,917,085 people shows no correlation between the proportion of Immigrants from Kuwait and median male earnings in the United States with a correlation coefficient (R) of 0.032 and weighted average of $57,562. Similarly, the statistical analysis conducted on geographies consisting of 150,194,615 people shows a poor positive correlation between the proportion of Immigrants from Belarus and median male earnings in the United States with a correlation coefficient (R) of 0.126 and weighted average of $62,658, a difference of 8.8%.
Median Male Earnings Correlation Summary
| Measurement | Immigrants from Kuwait | Immigrants from Belarus |
| Minimum | $4,638 | $27,820 |
| Maximum | $144,236 | $121,250 |
| Range | $139,598 | $93,430 |
| Mean | $59,941 | $64,628 |
| Median | $56,335 | $61,571 |
| Interquartile 25% (IQ1) | $48,946 | $52,308 |
| Interquartile 75% (IQ3) | $67,515 | $70,925 |
| Interquartile Range (IQR) | $18,568 | $18,618 |
| Standard Deviation (Sample) | $30,286 | $18,362 |
| Standard Deviation (Population) | $29,932 | $18,234 |
Similar Demographics by Median Male Earnings
Demographics Similar to Immigrants from Kuwait by Median Male Earnings
In terms of median male earnings, the demographic groups most similar to Immigrants from Kuwait are Carpatho Rusyn ($57,572, a difference of 0.020%), Immigrants from Afghanistan ($57,582, a difference of 0.040%), European ($57,637, a difference of 0.13%), Swedish ($57,445, a difference of 0.20%), and Lebanese ($57,409, a difference of 0.27%).
| Demographics | Rating | Rank | Median Male Earnings |
| Serbians | 96.8 /100 | #107 | Exceptional $57,975 |
| Immigrants | Uzbekistan | 96.7 /100 | #108 | Exceptional $57,941 |
| British | 96.5 /100 | #109 | Exceptional $57,890 |
| Palestinians | 96.2 /100 | #110 | Exceptional $57,778 |
| Europeans | 95.6 /100 | #111 | Exceptional $57,637 |
| Immigrants | Afghanistan | 95.4 /100 | #112 | Exceptional $57,582 |
| Carpatho Rusyns | 95.3 /100 | #113 | Exceptional $57,572 |
| Immigrants | Kuwait | 95.3 /100 | #114 | Exceptional $57,562 |
| Swedes | 94.8 /100 | #115 | Exceptional $57,445 |
| Lebanese | 94.6 /100 | #116 | Exceptional $57,409 |
| Immigrants | Zimbabwe | 94.3 /100 | #117 | Exceptional $57,352 |
| Hungarians | 94.0 /100 | #118 | Exceptional $57,309 |
| Arabs | 94.0 /100 | #119 | Exceptional $57,298 |
| Canadians | 93.9 /100 | #120 | Exceptional $57,286 |
| Immigrants | Albania | 93.3 /100 | #121 | Exceptional $57,179 |
Demographics Similar to Immigrants from Belarus by Median Male Earnings
In terms of median male earnings, the demographic groups most similar to Immigrants from Belarus are Immigrants from Greece ($62,689, a difference of 0.050%), Immigrants from Turkey ($62,728, a difference of 0.11%), Cambodian ($62,516, a difference of 0.23%), Australian ($62,857, a difference of 0.32%), and Immigrants from South Africa ($62,899, a difference of 0.38%).
| Demographics | Rating | Rank | Median Male Earnings |
| Israelis | 100.0 /100 | #36 | Exceptional $63,228 |
| Immigrants | Sri Lanka | 100.0 /100 | #37 | Exceptional $63,099 |
| Maltese | 100.0 /100 | #38 | Exceptional $62,953 |
| Immigrants | South Africa | 100.0 /100 | #39 | Exceptional $62,899 |
| Australians | 100.0 /100 | #40 | Exceptional $62,857 |
| Immigrants | Turkey | 100.0 /100 | #41 | Exceptional $62,728 |
| Immigrants | Greece | 100.0 /100 | #42 | Exceptional $62,689 |
| Immigrants | Belarus | 100.0 /100 | #43 | Exceptional $62,658 |
| Cambodians | 100.0 /100 | #44 | Exceptional $62,516 |
| Bulgarians | 100.0 /100 | #45 | Exceptional $62,378 |
| Immigrants | Czechoslovakia | 99.9 /100 | #46 | Exceptional $62,217 |
| Immigrants | Austria | 99.9 /100 | #47 | Exceptional $62,164 |
| Immigrants | Malaysia | 99.9 /100 | #48 | Exceptional $62,121 |
| Immigrants | Europe | 99.9 /100 | #49 | Exceptional $62,057 |
| Bhutanese | 99.9 /100 | #50 | Exceptional $61,759 |