Immigrants from Kuwait vs Yakama Householder Income Ages 25 - 44 years
COMPARE
Immigrants from Kuwait
Yakama
Householder Income Ages 25 - 44 years
Householder Income Ages 25 - 44 years Comparison
Immigrants from Kuwait
Yakama
$98,122
HOUSEHOLDER INCOME AGES 25 - 44 YEARS
87.8/ 100
METRIC RATING
130th/ 347
METRIC RANK
$76,226
HOUSEHOLDER INCOME AGES 25 - 44 YEARS
0.0/ 100
METRIC RATING
330th/ 347
METRIC RANK
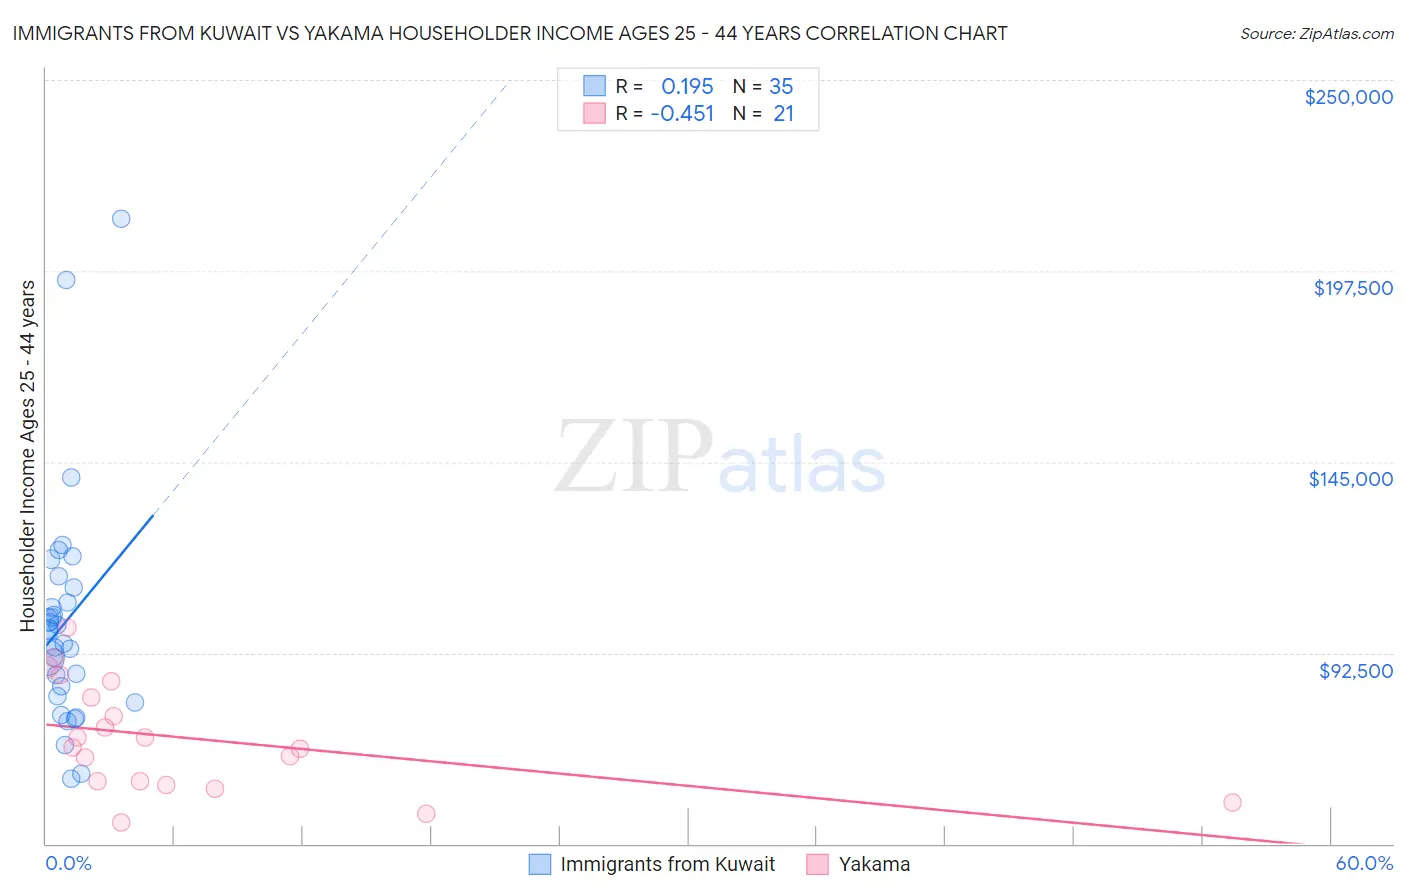
Immigrants from Kuwait vs Yakama Householder Income Ages 25 - 44 years Correlation Chart
The statistical analysis conducted on geographies consisting of 136,849,136 people shows a poor positive correlation between the proportion of Immigrants from Kuwait and household income with householder between the ages 25 and 44 in the United States with a correlation coefficient (R) of 0.195 and weighted average of $98,122. Similarly, the statistical analysis conducted on geographies consisting of 19,902,143 people shows a moderate negative correlation between the proportion of Yakama and household income with householder between the ages 25 and 44 in the United States with a correlation coefficient (R) of -0.451 and weighted average of $76,226, a difference of 28.7%.
Householder Income Ages 25 - 44 years Correlation Summary
| Measurement | Immigrants from Kuwait | Yakama |
| Minimum | $58,000 | $45,972 |
| Maximum | $211,833 | $99,532 |
| Range | $153,833 | $53,560 |
| Mean | $100,890 | $68,963 |
| Median | $98,273 | $66,512 |
| Interquartile 25% (IQ1) | $80,635 | $56,733 |
| Interquartile 75% (IQ3) | $110,365 | $82,417 |
| Interquartile Range (IQR) | $29,730 | $25,684 |
| Standard Deviation (Sample) | $31,630 | $14,961 |
| Standard Deviation (Population) | $31,175 | $14,600 |
Similar Demographics by Householder Income Ages 25 - 44 years
Demographics Similar to Immigrants from Kuwait by Householder Income Ages 25 - 44 years
In terms of householder income ages 25 - 44 years, the demographic groups most similar to Immigrants from Kuwait are Brazilian ($98,267, a difference of 0.15%), European ($98,310, a difference of 0.19%), Serbian ($98,320, a difference of 0.20%), Immigrants from Albania ($97,929, a difference of 0.20%), and British ($98,359, a difference of 0.24%).
| Demographics | Rating | Rank | Householder Income Ages 25 - 44 years |
| Palestinians | 91.2 /100 | #123 | Exceptional $98,777 |
| Zimbabweans | 90.3 /100 | #124 | Exceptional $98,586 |
| Pakistanis | 89.3 /100 | #125 | Excellent $98,401 |
| British | 89.1 /100 | #126 | Excellent $98,359 |
| Serbians | 88.9 /100 | #127 | Excellent $98,320 |
| Europeans | 88.9 /100 | #128 | Excellent $98,310 |
| Brazilians | 88.6 /100 | #129 | Excellent $98,267 |
| Immigrants | Kuwait | 87.8 /100 | #130 | Excellent $98,122 |
| Immigrants | Albania | 86.6 /100 | #131 | Excellent $97,929 |
| Immigrants | Zimbabwe | 86.3 /100 | #132 | Excellent $97,880 |
| Tsimshian | 85.8 /100 | #133 | Excellent $97,809 |
| Canadians | 84.5 /100 | #134 | Excellent $97,625 |
| Immigrants | Oceania | 84.5 /100 | #135 | Excellent $97,623 |
| Hungarians | 83.9 /100 | #136 | Excellent $97,544 |
| Lebanese | 82.3 /100 | #137 | Excellent $97,339 |
Demographics Similar to Yakama by Householder Income Ages 25 - 44 years
In terms of householder income ages 25 - 44 years, the demographic groups most similar to Yakama are Seminole ($76,584, a difference of 0.47%), Immigrants from Cuba ($76,701, a difference of 0.62%), Native/Alaskan ($75,647, a difference of 0.76%), Immigrants from Bahamas ($76,910, a difference of 0.90%), and Houma ($77,044, a difference of 1.1%).
| Demographics | Rating | Rank | Householder Income Ages 25 - 44 years |
| Immigrants | Honduras | 0.0 /100 | #323 | Tragic $77,328 |
| Dutch West Indians | 0.0 /100 | #324 | Tragic $77,260 |
| Sioux | 0.0 /100 | #325 | Tragic $77,089 |
| Houma | 0.0 /100 | #326 | Tragic $77,044 |
| Immigrants | Bahamas | 0.0 /100 | #327 | Tragic $76,910 |
| Immigrants | Cuba | 0.0 /100 | #328 | Tragic $76,701 |
| Seminole | 0.0 /100 | #329 | Tragic $76,584 |
| Yakama | 0.0 /100 | #330 | Tragic $76,226 |
| Natives/Alaskans | 0.0 /100 | #331 | Tragic $75,647 |
| Bahamians | 0.0 /100 | #332 | Tragic $75,395 |
| Hopi | 0.0 /100 | #333 | Tragic $75,002 |
| Creek | 0.0 /100 | #334 | Tragic $74,847 |
| Kiowa | 0.0 /100 | #335 | Tragic $74,776 |
| Yup'ik | 0.0 /100 | #336 | Tragic $73,688 |
| Blacks/African Americans | 0.0 /100 | #337 | Tragic $73,370 |