Immigrants from Kuwait vs Tlingit-Haida Householder Income Ages 25 - 44 years
COMPARE
Immigrants from Kuwait
Tlingit-Haida
Householder Income Ages 25 - 44 years
Householder Income Ages 25 - 44 years Comparison
Immigrants from Kuwait
Tlingit-Haida
$98,122
HOUSEHOLDER INCOME AGES 25 - 44 YEARS
87.8/ 100
METRIC RATING
130th/ 347
METRIC RANK
$92,987
HOUSEHOLDER INCOME AGES 25 - 44 YEARS
29.4/ 100
METRIC RATING
191st/ 347
METRIC RANK
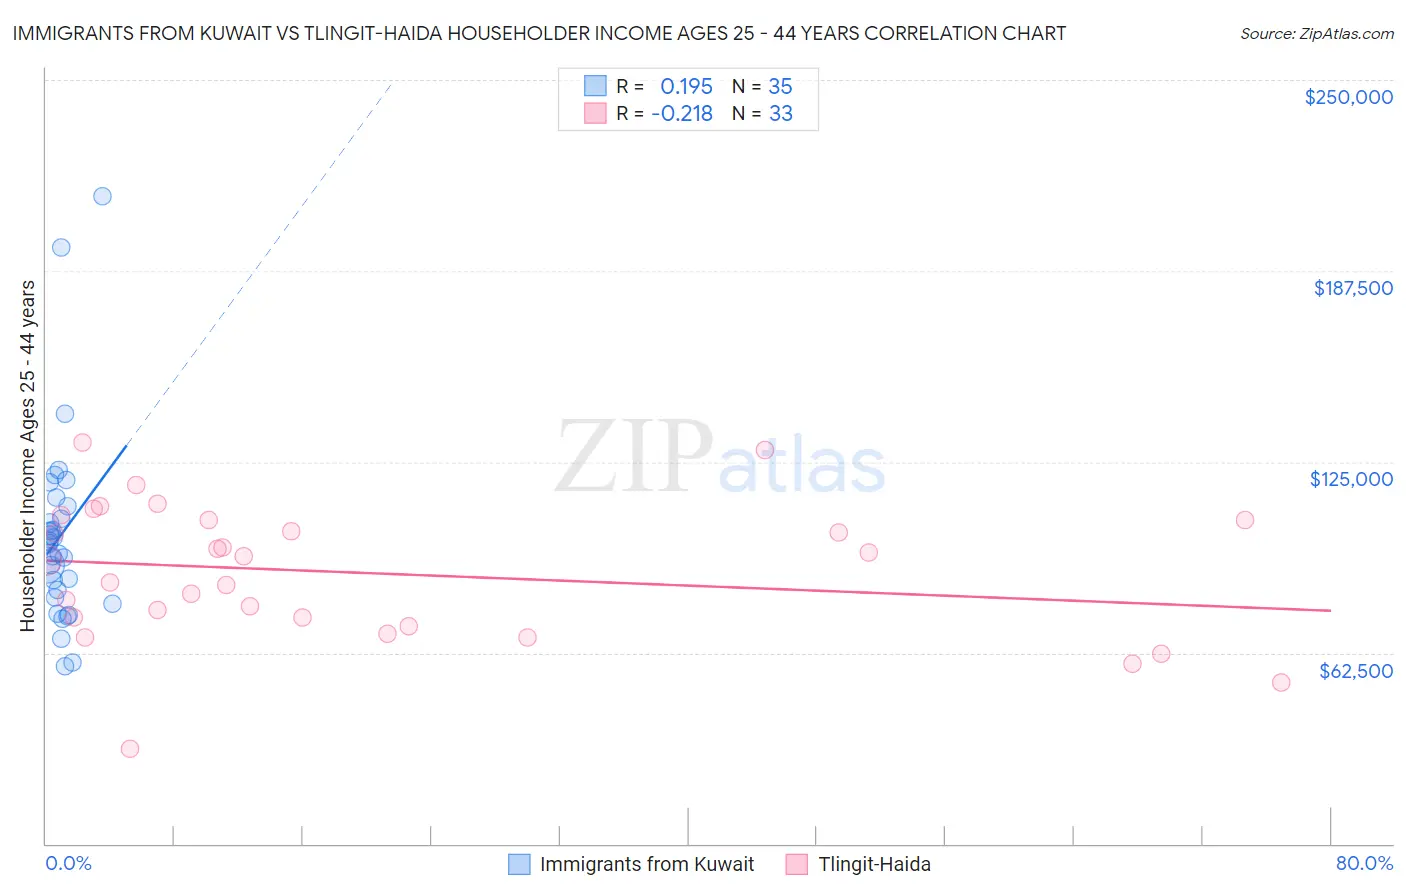
Immigrants from Kuwait vs Tlingit-Haida Householder Income Ages 25 - 44 years Correlation Chart
The statistical analysis conducted on geographies consisting of 136,849,136 people shows a poor positive correlation between the proportion of Immigrants from Kuwait and household income with householder between the ages 25 and 44 in the United States with a correlation coefficient (R) of 0.195 and weighted average of $98,122. Similarly, the statistical analysis conducted on geographies consisting of 60,815,061 people shows a weak negative correlation between the proportion of Tlingit-Haida and household income with householder between the ages 25 and 44 in the United States with a correlation coefficient (R) of -0.218 and weighted average of $92,987, a difference of 5.5%.
Householder Income Ages 25 - 44 years Correlation Summary
| Measurement | Immigrants from Kuwait | Tlingit-Haida |
| Minimum | $58,000 | $30,938 |
| Maximum | $211,833 | $131,395 |
| Range | $153,833 | $100,457 |
| Mean | $100,890 | $88,610 |
| Median | $98,273 | $92,732 |
| Interquartile 25% (IQ1) | $80,635 | $72,697 |
| Interquartile 75% (IQ3) | $110,365 | $105,957 |
| Interquartile Range (IQR) | $29,730 | $33,260 |
| Standard Deviation (Sample) | $31,630 | $22,410 |
| Standard Deviation (Population) | $31,175 | $22,068 |
Similar Demographics by Householder Income Ages 25 - 44 years
Demographics Similar to Immigrants from Kuwait by Householder Income Ages 25 - 44 years
In terms of householder income ages 25 - 44 years, the demographic groups most similar to Immigrants from Kuwait are Brazilian ($98,267, a difference of 0.15%), European ($98,310, a difference of 0.19%), Serbian ($98,320, a difference of 0.20%), Immigrants from Albania ($97,929, a difference of 0.20%), and British ($98,359, a difference of 0.24%).
| Demographics | Rating | Rank | Householder Income Ages 25 - 44 years |
| Palestinians | 91.2 /100 | #123 | Exceptional $98,777 |
| Zimbabweans | 90.3 /100 | #124 | Exceptional $98,586 |
| Pakistanis | 89.3 /100 | #125 | Excellent $98,401 |
| British | 89.1 /100 | #126 | Excellent $98,359 |
| Serbians | 88.9 /100 | #127 | Excellent $98,320 |
| Europeans | 88.9 /100 | #128 | Excellent $98,310 |
| Brazilians | 88.6 /100 | #129 | Excellent $98,267 |
| Immigrants | Kuwait | 87.8 /100 | #130 | Excellent $98,122 |
| Immigrants | Albania | 86.6 /100 | #131 | Excellent $97,929 |
| Immigrants | Zimbabwe | 86.3 /100 | #132 | Excellent $97,880 |
| Tsimshian | 85.8 /100 | #133 | Excellent $97,809 |
| Canadians | 84.5 /100 | #134 | Excellent $97,625 |
| Immigrants | Oceania | 84.5 /100 | #135 | Excellent $97,623 |
| Hungarians | 83.9 /100 | #136 | Excellent $97,544 |
| Lebanese | 82.3 /100 | #137 | Excellent $97,339 |
Demographics Similar to Tlingit-Haida by Householder Income Ages 25 - 44 years
In terms of householder income ages 25 - 44 years, the demographic groups most similar to Tlingit-Haida are Welsh ($93,039, a difference of 0.060%), Dutch ($93,081, a difference of 0.10%), Immigrants from Costa Rica ($92,876, a difference of 0.12%), Immigrants from Sierra Leone ($93,115, a difference of 0.14%), and Spaniard ($93,366, a difference of 0.41%).
| Demographics | Rating | Rank | Householder Income Ages 25 - 44 years |
| Germans | 36.0 /100 | #184 | Fair $93,531 |
| Immigrants | Eritrea | 35.2 /100 | #185 | Fair $93,466 |
| Sierra Leoneans | 34.8 /100 | #186 | Fair $93,435 |
| Spaniards | 34.0 /100 | #187 | Fair $93,366 |
| Immigrants | Sierra Leone | 30.9 /100 | #188 | Fair $93,115 |
| Dutch | 30.5 /100 | #189 | Fair $93,081 |
| Welsh | 30.0 /100 | #190 | Fair $93,039 |
| Tlingit-Haida | 29.4 /100 | #191 | Fair $92,987 |
| Immigrants | Costa Rica | 28.2 /100 | #192 | Fair $92,876 |
| Samoans | 23.0 /100 | #193 | Fair $92,385 |
| Immigrants | Azores | 22.4 /100 | #194 | Fair $92,322 |
| Celtics | 21.6 /100 | #195 | Fair $92,241 |
| Immigrants | Colombia | 21.3 /100 | #196 | Fair $92,204 |
| Spanish | 21.2 /100 | #197 | Fair $92,200 |
| Vietnamese | 20.2 /100 | #198 | Fair $92,089 |