Delaware vs Chippewa Per Capita Income
COMPARE
Delaware
Chippewa
Per Capita Income
Per Capita Income Comparison
Delaware
Chippewa
$40,778
PER CAPITA INCOME
3.8/ 100
METRIC RATING
233rd/ 347
METRIC RANK
$36,631
PER CAPITA INCOME
0.0/ 100
METRIC RATING
311th/ 347
METRIC RANK
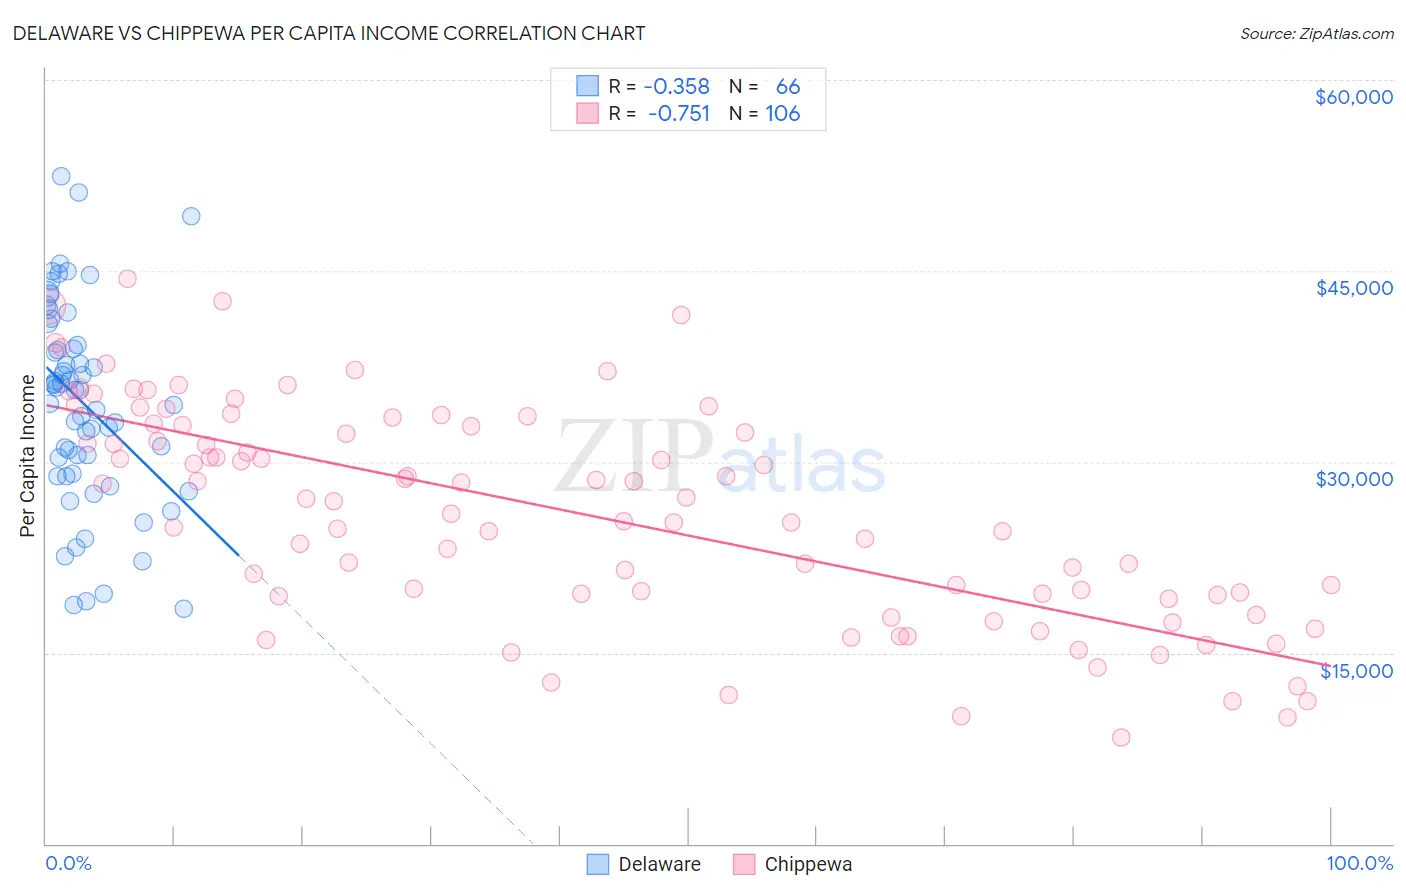
Delaware vs Chippewa Per Capita Income Correlation Chart
The statistical analysis conducted on geographies consisting of 96,239,490 people shows a mild negative correlation between the proportion of Delaware and per capita income in the United States with a correlation coefficient (R) of -0.358 and weighted average of $40,778. Similarly, the statistical analysis conducted on geographies consisting of 215,067,961 people shows a strong negative correlation between the proportion of Chippewa and per capita income in the United States with a correlation coefficient (R) of -0.751 and weighted average of $36,631, a difference of 11.3%.
Per Capita Income Correlation Summary
| Measurement | Delaware | Chippewa |
| Minimum | $18,507 | $8,325 |
| Maximum | $52,470 | $44,407 |
| Range | $33,963 | $36,082 |
| Mean | $34,628 | $25,989 |
| Median | $35,673 | $27,024 |
| Interquartile 25% (IQ1) | $29,044 | $19,564 |
| Interquartile 75% (IQ3) | $39,167 | $32,911 |
| Interquartile Range (IQR) | $10,124 | $13,347 |
| Standard Deviation (Sample) | $7,889 | $8,516 |
| Standard Deviation (Population) | $7,829 | $8,476 |
Similar Demographics by Per Capita Income
Demographics Similar to Delaware by Per Capita Income
In terms of per capita income, the demographic groups most similar to Delaware are Immigrants from West Indies ($40,763, a difference of 0.040%), Immigrants from Guyana ($40,742, a difference of 0.090%), Nonimmigrants ($40,669, a difference of 0.27%), Guyanese ($40,949, a difference of 0.42%), and Senegalese ($41,000, a difference of 0.55%).
| Demographics | Rating | Rank | Per Capita Income |
| Immigrants | Ecuador | 5.9 /100 | #226 | Tragic $41,195 |
| Immigrants | Ghana | 5.5 /100 | #227 | Tragic $41,131 |
| Immigrants | Grenada | 5.5 /100 | #228 | Tragic $41,123 |
| Nigerians | 4.9 /100 | #229 | Tragic $41,026 |
| Native Hawaiians | 4.9 /100 | #230 | Tragic $41,017 |
| Senegalese | 4.8 /100 | #231 | Tragic $41,000 |
| Guyanese | 4.5 /100 | #232 | Tragic $40,949 |
| Delaware | 3.8 /100 | #233 | Tragic $40,778 |
| Immigrants | West Indies | 3.7 /100 | #234 | Tragic $40,763 |
| Immigrants | Guyana | 3.6 /100 | #235 | Tragic $40,742 |
| Immigrants | Nonimmigrants | 3.4 /100 | #236 | Tragic $40,669 |
| Immigrants | Cambodia | 2.6 /100 | #237 | Tragic $40,434 |
| Somalis | 2.4 /100 | #238 | Tragic $40,367 |
| Tsimshian | 2.4 /100 | #239 | Tragic $40,344 |
| Immigrants | Nigeria | 2.3 /100 | #240 | Tragic $40,339 |
Demographics Similar to Chippewa by Per Capita Income
In terms of per capita income, the demographic groups most similar to Chippewa are Ute ($36,651, a difference of 0.060%), Immigrants from Honduras ($36,665, a difference of 0.090%), Fijian ($36,690, a difference of 0.16%), Chickasaw ($36,475, a difference of 0.43%), and Immigrants from Latin America ($36,823, a difference of 0.53%).
| Demographics | Rating | Rank | Per Capita Income |
| Hondurans | 0.1 /100 | #304 | Tragic $37,031 |
| Inupiat | 0.1 /100 | #305 | Tragic $36,999 |
| Immigrants | Haiti | 0.0 /100 | #306 | Tragic $36,849 |
| Immigrants | Latin America | 0.0 /100 | #307 | Tragic $36,823 |
| Fijians | 0.0 /100 | #308 | Tragic $36,690 |
| Immigrants | Honduras | 0.0 /100 | #309 | Tragic $36,665 |
| Ute | 0.0 /100 | #310 | Tragic $36,651 |
| Chippewa | 0.0 /100 | #311 | Tragic $36,631 |
| Chickasaw | 0.0 /100 | #312 | Tragic $36,475 |
| Bahamians | 0.0 /100 | #313 | Tragic $36,427 |
| Seminole | 0.0 /100 | #314 | Tragic $36,180 |
| Yaqui | 0.0 /100 | #315 | Tragic $36,112 |
| Choctaw | 0.0 /100 | #316 | Tragic $35,999 |
| Dutch West Indians | 0.0 /100 | #317 | Tragic $35,922 |
| Bangladeshis | 0.0 /100 | #318 | Tragic $35,897 |