Immigrants from Jordan vs Creek Per Capita Income
COMPARE
Immigrants from Jordan
Creek
Per Capita Income
Per Capita Income Comparison
Immigrants from Jordan
Creek
$45,066
PER CAPITA INCOME
82.9/ 100
METRIC RATING
140th/ 347
METRIC RANK
$35,546
PER CAPITA INCOME
0.0/ 100
METRIC RATING
322nd/ 347
METRIC RANK
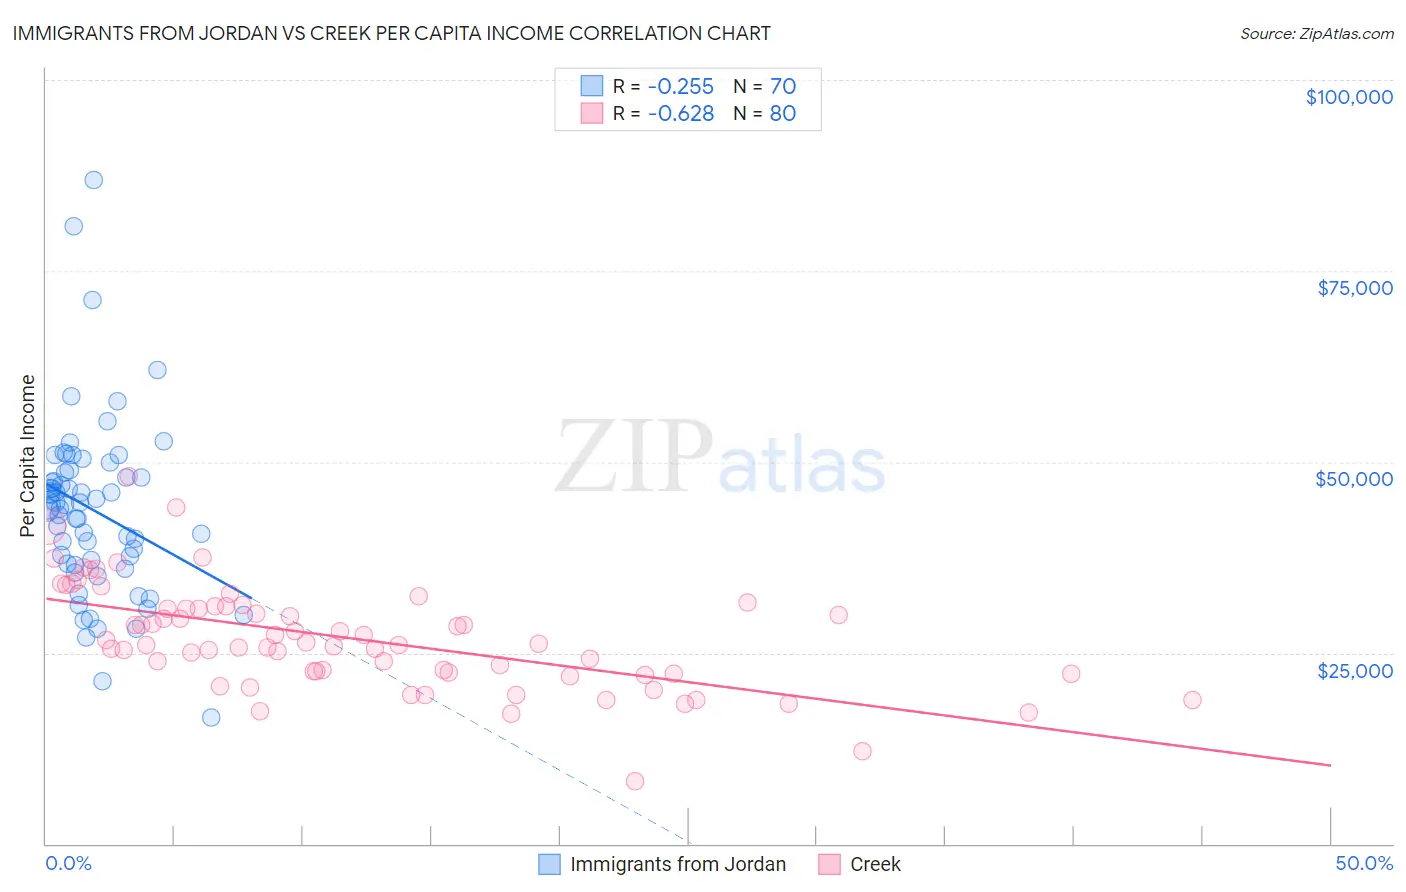
Immigrants from Jordan vs Creek Per Capita Income Correlation Chart
The statistical analysis conducted on geographies consisting of 181,275,408 people shows a weak negative correlation between the proportion of Immigrants from Jordan and per capita income in the United States with a correlation coefficient (R) of -0.255 and weighted average of $45,066. Similarly, the statistical analysis conducted on geographies consisting of 178,484,884 people shows a significant negative correlation between the proportion of Creek and per capita income in the United States with a correlation coefficient (R) of -0.628 and weighted average of $35,546, a difference of 26.8%.
Per Capita Income Correlation Summary
| Measurement | Immigrants from Jordan | Creek |
| Minimum | $16,508 | $8,185 |
| Maximum | $86,887 | $48,038 |
| Range | $70,379 | $39,853 |
| Mean | $43,703 | $26,882 |
| Median | $44,361 | $26,137 |
| Interquartile 25% (IQ1) | $36,695 | $22,339 |
| Interquartile 75% (IQ3) | $48,682 | $30,941 |
| Interquartile Range (IQR) | $11,987 | $8,603 |
| Standard Deviation (Sample) | $11,687 | $6,895 |
| Standard Deviation (Population) | $11,603 | $6,852 |
Similar Demographics by Per Capita Income
Demographics Similar to Immigrants from Jordan by Per Capita Income
In terms of per capita income, the demographic groups most similar to Immigrants from Jordan are Slavic ($45,049, a difference of 0.040%), Ugandan ($45,047, a difference of 0.040%), Basque ($45,086, a difference of 0.050%), Immigrants from Uganda ($45,043, a difference of 0.050%), and Icelander ($44,987, a difference of 0.18%).
| Demographics | Rating | Rank | Per Capita Income |
| Pakistanis | 89.7 /100 | #133 | Excellent $45,587 |
| Slovenes | 89.6 /100 | #134 | Excellent $45,581 |
| Hungarians | 87.9 /100 | #135 | Excellent $45,426 |
| Immigrants | Oceania | 85.2 /100 | #136 | Excellent $45,220 |
| Immigrants | Syria | 85.2 /100 | #137 | Excellent $45,218 |
| Assyrians/Chaldeans/Syriacs | 84.8 /100 | #138 | Excellent $45,195 |
| Basques | 83.2 /100 | #139 | Excellent $45,086 |
| Immigrants | Jordan | 82.9 /100 | #140 | Excellent $45,066 |
| Slavs | 82.6 /100 | #141 | Excellent $45,049 |
| Ugandans | 82.6 /100 | #142 | Excellent $45,047 |
| Immigrants | Uganda | 82.5 /100 | #143 | Excellent $45,043 |
| Icelanders | 81.6 /100 | #144 | Excellent $44,987 |
| Immigrants | Afghanistan | 78.0 /100 | #145 | Good $44,790 |
| Irish | 75.8 /100 | #146 | Good $44,679 |
| Czechs | 74.1 /100 | #147 | Good $44,595 |
Demographics Similar to Creek by Per Capita Income
In terms of per capita income, the demographic groups most similar to Creek are Black/African American ($35,564, a difference of 0.050%), Hispanic or Latino ($35,688, a difference of 0.40%), Immigrants from Congo ($35,720, a difference of 0.49%), Cheyenne ($35,276, a difference of 0.76%), and Bangladeshi ($35,897, a difference of 0.99%).
| Demographics | Rating | Rank | Per Capita Income |
| Yaqui | 0.0 /100 | #315 | Tragic $36,112 |
| Choctaw | 0.0 /100 | #316 | Tragic $35,999 |
| Dutch West Indians | 0.0 /100 | #317 | Tragic $35,922 |
| Bangladeshis | 0.0 /100 | #318 | Tragic $35,897 |
| Immigrants | Congo | 0.0 /100 | #319 | Tragic $35,720 |
| Hispanics or Latinos | 0.0 /100 | #320 | Tragic $35,688 |
| Blacks/African Americans | 0.0 /100 | #321 | Tragic $35,564 |
| Creek | 0.0 /100 | #322 | Tragic $35,546 |
| Cheyenne | 0.0 /100 | #323 | Tragic $35,276 |
| Kiowa | 0.0 /100 | #324 | Tragic $35,102 |
| Immigrants | Central America | 0.0 /100 | #325 | Tragic $34,974 |
| Immigrants | Cuba | 0.0 /100 | #326 | Tragic $34,910 |
| Apache | 0.0 /100 | #327 | Tragic $34,886 |
| Menominee | 0.0 /100 | #328 | Tragic $34,578 |
| Mexicans | 0.0 /100 | #329 | Tragic $34,559 |