Immigrants from South America vs Chippewa Per Capita Income
COMPARE
Immigrants from South America
Chippewa
Per Capita Income
Per Capita Income Comparison
Immigrants from South America
Chippewa
$44,068
PER CAPITA INCOME
61.2/ 100
METRIC RATING
163rd/ 347
METRIC RANK
$36,631
PER CAPITA INCOME
0.0/ 100
METRIC RATING
311th/ 347
METRIC RANK
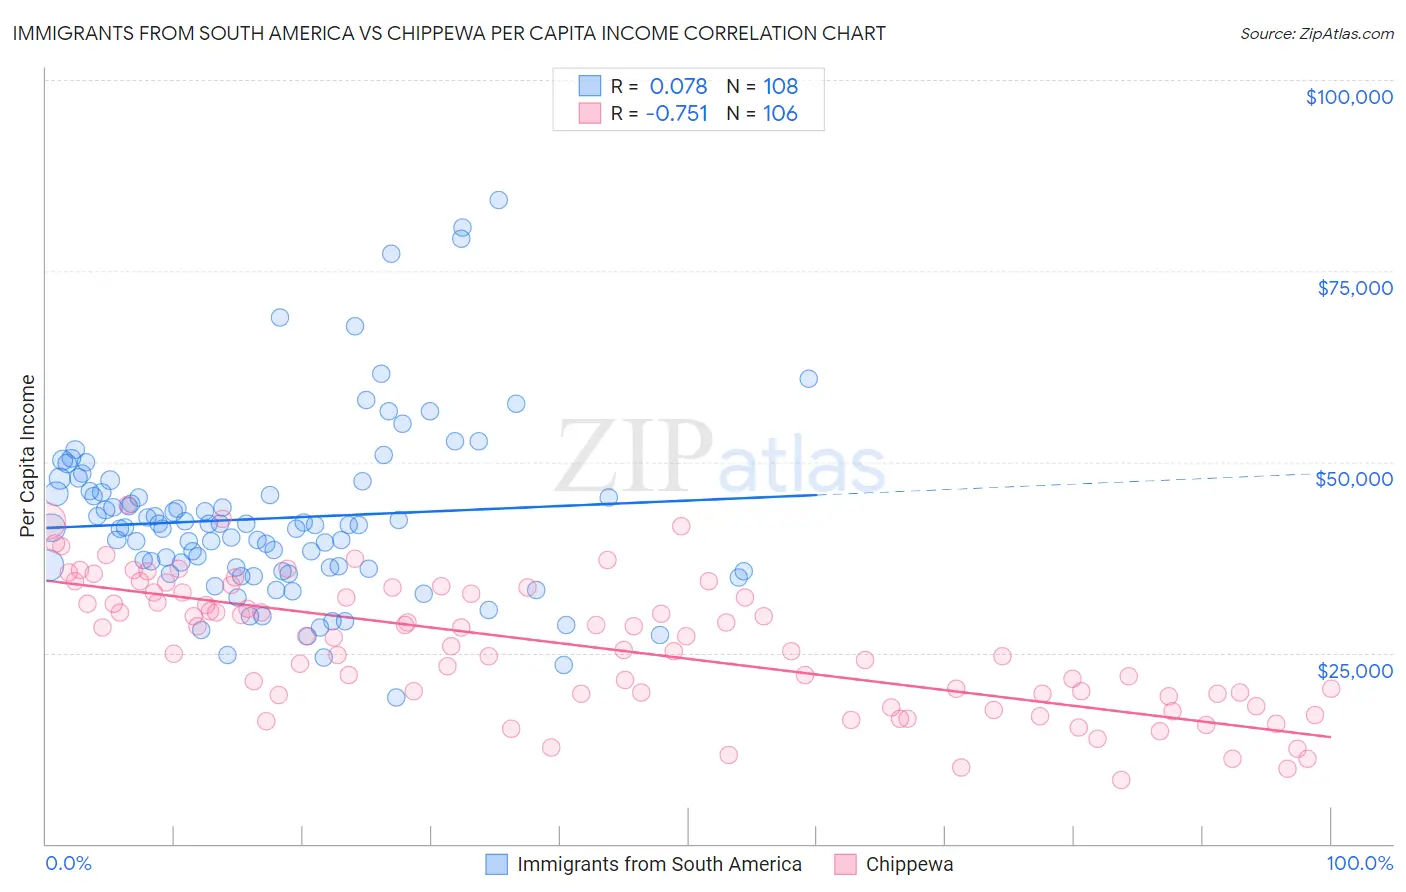
Immigrants from South America vs Chippewa Per Capita Income Correlation Chart
The statistical analysis conducted on geographies consisting of 486,454,612 people shows a slight positive correlation between the proportion of Immigrants from South America and per capita income in the United States with a correlation coefficient (R) of 0.078 and weighted average of $44,068. Similarly, the statistical analysis conducted on geographies consisting of 215,067,961 people shows a strong negative correlation between the proportion of Chippewa and per capita income in the United States with a correlation coefficient (R) of -0.751 and weighted average of $36,631, a difference of 20.3%.
Per Capita Income Correlation Summary
| Measurement | Immigrants from South America | Chippewa |
| Minimum | $19,195 | $8,325 |
| Maximum | $84,313 | $44,407 |
| Range | $65,118 | $36,082 |
| Mean | $42,614 | $25,989 |
| Median | $41,568 | $27,024 |
| Interquartile 25% (IQ1) | $35,887 | $19,564 |
| Interquartile 75% (IQ3) | $46,069 | $32,911 |
| Interquartile Range (IQR) | $10,183 | $13,347 |
| Standard Deviation (Sample) | $11,625 | $8,516 |
| Standard Deviation (Population) | $11,572 | $8,476 |
Similar Demographics by Per Capita Income
Demographics Similar to Immigrants from South America by Per Capita Income
In terms of per capita income, the demographic groups most similar to Immigrants from South America are Swiss ($44,076, a difference of 0.020%), Costa Rican ($44,090, a difference of 0.050%), Danish ($44,095, a difference of 0.060%), South American ($44,114, a difference of 0.10%), and Sri Lankan ($44,014, a difference of 0.12%).
| Demographics | Rating | Rank | Per Capita Income |
| Slovaks | 65.4 /100 | #156 | Good $44,229 |
| South American Indians | 64.8 /100 | #157 | Good $44,206 |
| Immigrants | Nepal | 64.3 /100 | #158 | Good $44,187 |
| South Americans | 62.4 /100 | #159 | Good $44,114 |
| Danes | 61.9 /100 | #160 | Good $44,095 |
| Costa Ricans | 61.8 /100 | #161 | Good $44,090 |
| Swiss | 61.4 /100 | #162 | Good $44,076 |
| Immigrants | South America | 61.2 /100 | #163 | Good $44,068 |
| Sri Lankans | 59.8 /100 | #164 | Average $44,014 |
| Immigrants | Philippines | 59.4 /100 | #165 | Average $44,000 |
| Immigrants | Uruguay | 59.3 /100 | #166 | Average $43,997 |
| English | 58.9 /100 | #167 | Average $43,982 |
| Belgians | 58.1 /100 | #168 | Average $43,951 |
| Immigrants | Peru | 55.3 /100 | #169 | Average $43,852 |
| Scandinavians | 55.2 /100 | #170 | Average $43,848 |
Demographics Similar to Chippewa by Per Capita Income
In terms of per capita income, the demographic groups most similar to Chippewa are Ute ($36,651, a difference of 0.060%), Immigrants from Honduras ($36,665, a difference of 0.090%), Fijian ($36,690, a difference of 0.16%), Chickasaw ($36,475, a difference of 0.43%), and Immigrants from Latin America ($36,823, a difference of 0.53%).
| Demographics | Rating | Rank | Per Capita Income |
| Hondurans | 0.1 /100 | #304 | Tragic $37,031 |
| Inupiat | 0.1 /100 | #305 | Tragic $36,999 |
| Immigrants | Haiti | 0.0 /100 | #306 | Tragic $36,849 |
| Immigrants | Latin America | 0.0 /100 | #307 | Tragic $36,823 |
| Fijians | 0.0 /100 | #308 | Tragic $36,690 |
| Immigrants | Honduras | 0.0 /100 | #309 | Tragic $36,665 |
| Ute | 0.0 /100 | #310 | Tragic $36,651 |
| Chippewa | 0.0 /100 | #311 | Tragic $36,631 |
| Chickasaw | 0.0 /100 | #312 | Tragic $36,475 |
| Bahamians | 0.0 /100 | #313 | Tragic $36,427 |
| Seminole | 0.0 /100 | #314 | Tragic $36,180 |
| Yaqui | 0.0 /100 | #315 | Tragic $36,112 |
| Choctaw | 0.0 /100 | #316 | Tragic $35,999 |
| Dutch West Indians | 0.0 /100 | #317 | Tragic $35,922 |
| Bangladeshis | 0.0 /100 | #318 | Tragic $35,897 |