Spanish American Indian vs Chippewa Per Capita Income
COMPARE
Spanish American Indian
Chippewa
Per Capita Income
Per Capita Income Comparison
Spanish American Indians
Chippewa
$34,195
PER CAPITA INCOME
0.0/ 100
METRIC RATING
330th/ 347
METRIC RANK
$36,631
PER CAPITA INCOME
0.0/ 100
METRIC RATING
311th/ 347
METRIC RANK
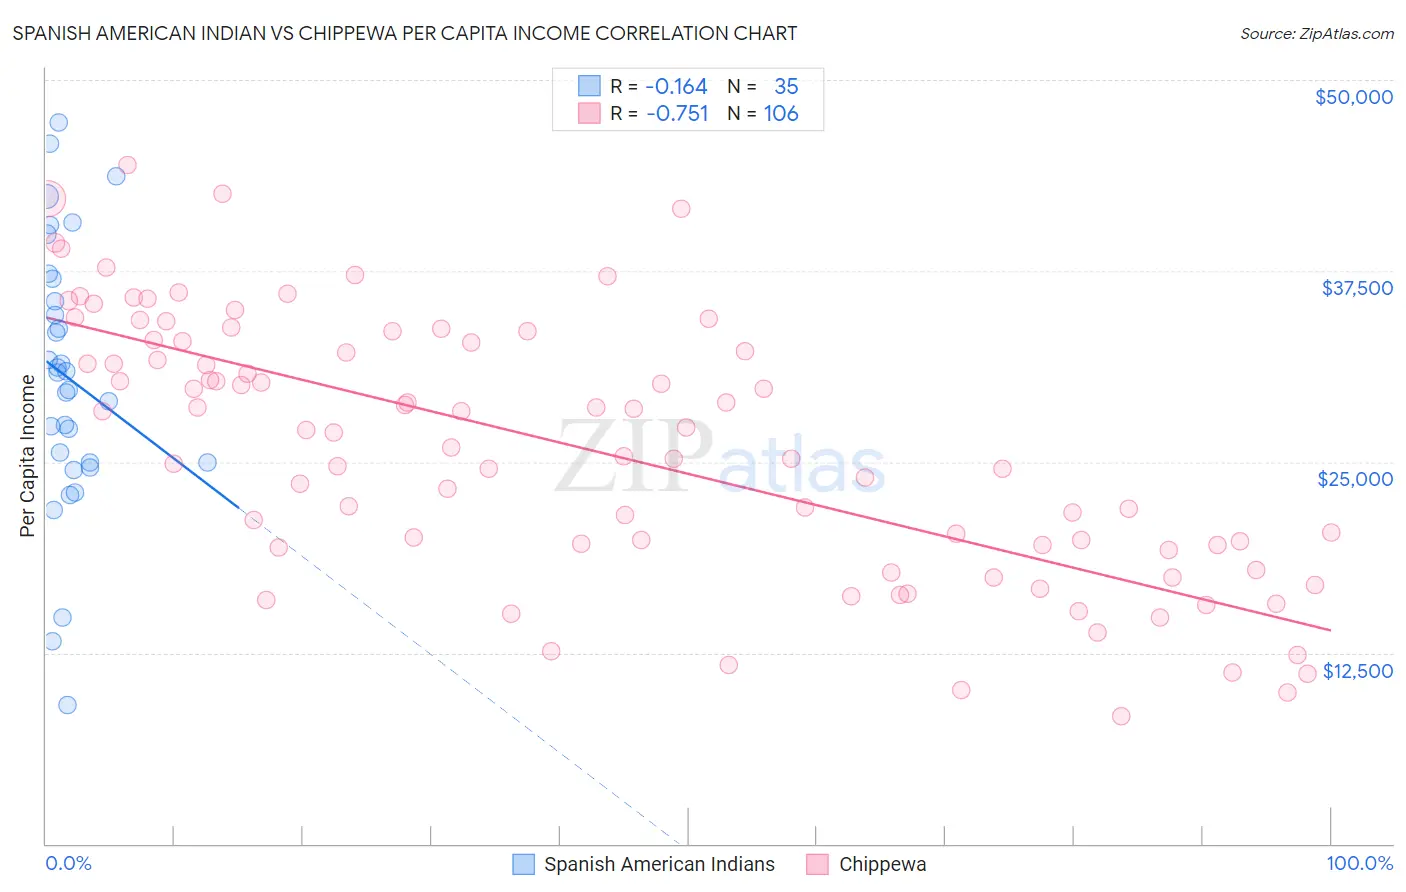
Spanish American Indian vs Chippewa Per Capita Income Correlation Chart
The statistical analysis conducted on geographies consisting of 73,150,359 people shows a poor negative correlation between the proportion of Spanish American Indians and per capita income in the United States with a correlation coefficient (R) of -0.164 and weighted average of $34,195. Similarly, the statistical analysis conducted on geographies consisting of 215,067,961 people shows a strong negative correlation between the proportion of Chippewa and per capita income in the United States with a correlation coefficient (R) of -0.751 and weighted average of $36,631, a difference of 7.1%.
Per Capita Income Correlation Summary
| Measurement | Spanish American Indian | Chippewa |
| Minimum | $9,061 | $8,325 |
| Maximum | $47,199 | $44,407 |
| Range | $38,138 | $36,082 |
| Mean | $30,495 | $25,989 |
| Median | $30,854 | $27,024 |
| Interquartile 25% (IQ1) | $24,953 | $19,564 |
| Interquartile 75% (IQ3) | $37,015 | $32,911 |
| Interquartile Range (IQR) | $12,062 | $13,347 |
| Standard Deviation (Sample) | $8,840 | $8,516 |
| Standard Deviation (Population) | $8,713 | $8,476 |
Demographics Similar to Spanish American Indians and Chippewa by Per Capita Income
In terms of per capita income, the demographic groups most similar to Spanish American Indians are Mexican ($34,559, a difference of 1.1%), Menominee ($34,578, a difference of 1.1%), Apache ($34,886, a difference of 2.0%), Immigrants from Cuba ($34,910, a difference of 2.1%), and Immigrants from Central America ($34,974, a difference of 2.3%). Similarly, the demographic groups most similar to Chippewa are Ute ($36,651, a difference of 0.060%), Chickasaw ($36,475, a difference of 0.43%), Bahamian ($36,427, a difference of 0.56%), Seminole ($36,180, a difference of 1.2%), and Yaqui ($36,112, a difference of 1.4%).
| Demographics | Rating | Rank | Per Capita Income |
| Ute | 0.0 /100 | #310 | Tragic $36,651 |
| Chippewa | 0.0 /100 | #311 | Tragic $36,631 |
| Chickasaw | 0.0 /100 | #312 | Tragic $36,475 |
| Bahamians | 0.0 /100 | #313 | Tragic $36,427 |
| Seminole | 0.0 /100 | #314 | Tragic $36,180 |
| Yaqui | 0.0 /100 | #315 | Tragic $36,112 |
| Choctaw | 0.0 /100 | #316 | Tragic $35,999 |
| Dutch West Indians | 0.0 /100 | #317 | Tragic $35,922 |
| Bangladeshis | 0.0 /100 | #318 | Tragic $35,897 |
| Immigrants | Congo | 0.0 /100 | #319 | Tragic $35,720 |
| Hispanics or Latinos | 0.0 /100 | #320 | Tragic $35,688 |
| Blacks/African Americans | 0.0 /100 | #321 | Tragic $35,564 |
| Creek | 0.0 /100 | #322 | Tragic $35,546 |
| Cheyenne | 0.0 /100 | #323 | Tragic $35,276 |
| Kiowa | 0.0 /100 | #324 | Tragic $35,102 |
| Immigrants | Central America | 0.0 /100 | #325 | Tragic $34,974 |
| Immigrants | Cuba | 0.0 /100 | #326 | Tragic $34,910 |
| Apache | 0.0 /100 | #327 | Tragic $34,886 |
| Menominee | 0.0 /100 | #328 | Tragic $34,578 |
| Mexicans | 0.0 /100 | #329 | Tragic $34,559 |
| Spanish American Indians | 0.0 /100 | #330 | Tragic $34,195 |