Immigrants from Jordan vs Immigrants from Cabo Verde Per Capita Income
COMPARE
Immigrants from Jordan
Immigrants from Cabo Verde
Per Capita Income
Per Capita Income Comparison
Immigrants from Jordan
Immigrants from Cabo Verde
$45,066
PER CAPITA INCOME
82.9/ 100
METRIC RATING
140th/ 347
METRIC RANK
$38,540
PER CAPITA INCOME
0.3/ 100
METRIC RATING
272nd/ 347
METRIC RANK
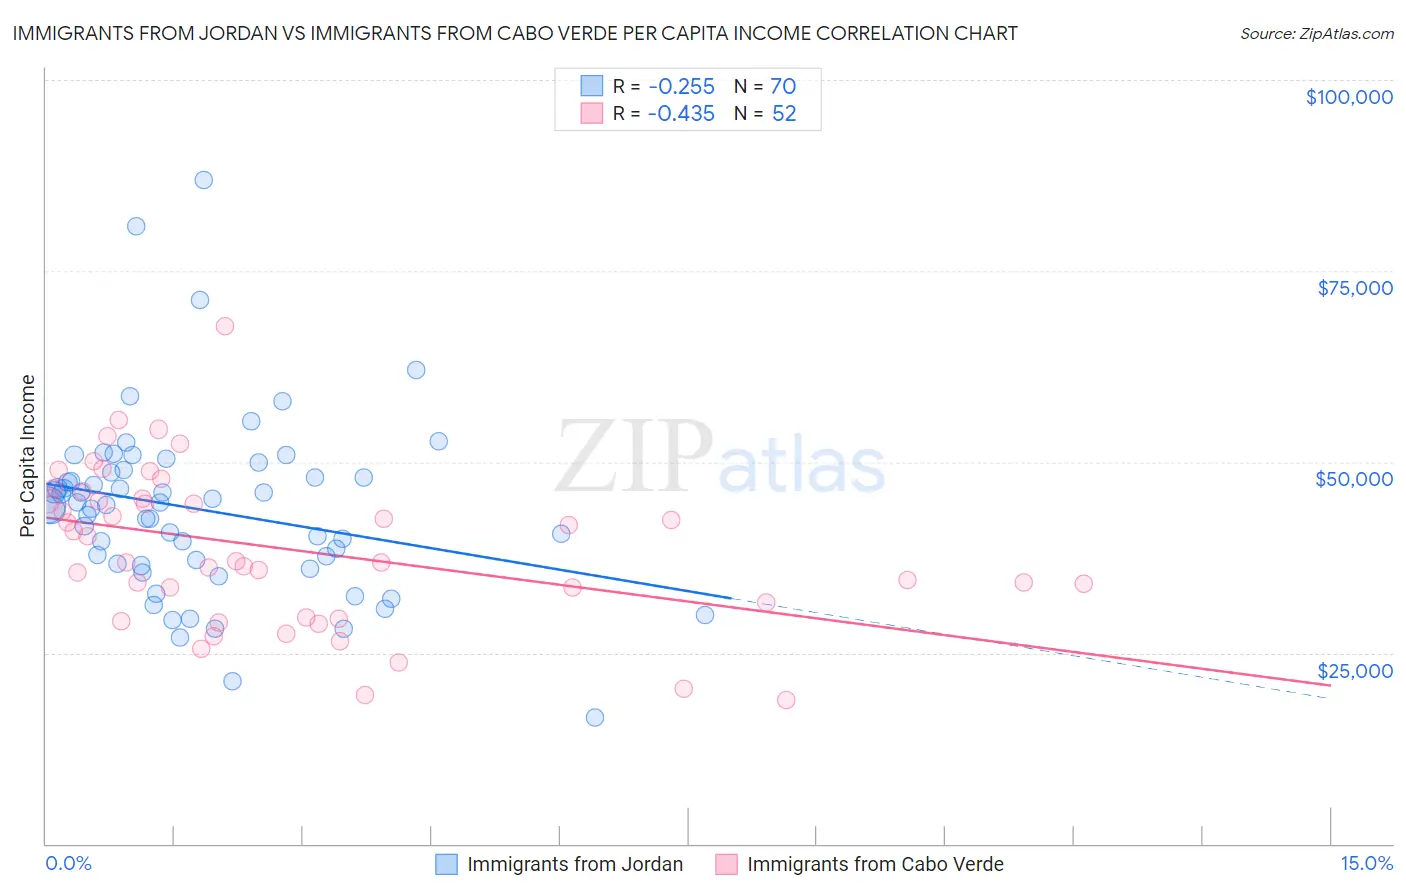
Immigrants from Jordan vs Immigrants from Cabo Verde Per Capita Income Correlation Chart
The statistical analysis conducted on geographies consisting of 181,275,408 people shows a weak negative correlation between the proportion of Immigrants from Jordan and per capita income in the United States with a correlation coefficient (R) of -0.255 and weighted average of $45,066. Similarly, the statistical analysis conducted on geographies consisting of 38,153,224 people shows a moderate negative correlation between the proportion of Immigrants from Cabo Verde and per capita income in the United States with a correlation coefficient (R) of -0.435 and weighted average of $38,540, a difference of 16.9%.
Per Capita Income Correlation Summary
| Measurement | Immigrants from Jordan | Immigrants from Cabo Verde |
| Minimum | $16,508 | $18,870 |
| Maximum | $86,887 | $67,818 |
| Range | $70,379 | $48,948 |
| Mean | $43,703 | $38,585 |
| Median | $44,361 | $36,913 |
| Interquartile 25% (IQ1) | $36,695 | $30,580 |
| Interquartile 75% (IQ3) | $48,682 | $45,064 |
| Interquartile Range (IQR) | $11,987 | $14,484 |
| Standard Deviation (Sample) | $11,687 | $10,185 |
| Standard Deviation (Population) | $11,603 | $10,087 |
Similar Demographics by Per Capita Income
Demographics Similar to Immigrants from Jordan by Per Capita Income
In terms of per capita income, the demographic groups most similar to Immigrants from Jordan are Slavic ($45,049, a difference of 0.040%), Ugandan ($45,047, a difference of 0.040%), Basque ($45,086, a difference of 0.050%), Immigrants from Uganda ($45,043, a difference of 0.050%), and Icelander ($44,987, a difference of 0.18%).
| Demographics | Rating | Rank | Per Capita Income |
| Pakistanis | 89.7 /100 | #133 | Excellent $45,587 |
| Slovenes | 89.6 /100 | #134 | Excellent $45,581 |
| Hungarians | 87.9 /100 | #135 | Excellent $45,426 |
| Immigrants | Oceania | 85.2 /100 | #136 | Excellent $45,220 |
| Immigrants | Syria | 85.2 /100 | #137 | Excellent $45,218 |
| Assyrians/Chaldeans/Syriacs | 84.8 /100 | #138 | Excellent $45,195 |
| Basques | 83.2 /100 | #139 | Excellent $45,086 |
| Immigrants | Jordan | 82.9 /100 | #140 | Excellent $45,066 |
| Slavs | 82.6 /100 | #141 | Excellent $45,049 |
| Ugandans | 82.6 /100 | #142 | Excellent $45,047 |
| Immigrants | Uganda | 82.5 /100 | #143 | Excellent $45,043 |
| Icelanders | 81.6 /100 | #144 | Excellent $44,987 |
| Immigrants | Afghanistan | 78.0 /100 | #145 | Good $44,790 |
| Irish | 75.8 /100 | #146 | Good $44,679 |
| Czechs | 74.1 /100 | #147 | Good $44,595 |
Demographics Similar to Immigrants from Cabo Verde by Per Capita Income
In terms of per capita income, the demographic groups most similar to Immigrants from Cabo Verde are Central American ($38,560, a difference of 0.050%), Immigrants from Belize ($38,614, a difference of 0.19%), Nepalese ($38,442, a difference of 0.25%), Immigrants from El Salvador ($38,394, a difference of 0.38%), and Immigrants from Jamaica ($38,766, a difference of 0.59%).
| Demographics | Rating | Rank | Per Capita Income |
| Spanish Americans | 0.5 /100 | #265 | Tragic $39,012 |
| Salvadorans | 0.5 /100 | #266 | Tragic $38,858 |
| Immigrants | Zaire | 0.4 /100 | #267 | Tragic $38,848 |
| Liberians | 0.4 /100 | #268 | Tragic $38,780 |
| Immigrants | Jamaica | 0.4 /100 | #269 | Tragic $38,766 |
| Immigrants | Belize | 0.3 /100 | #270 | Tragic $38,614 |
| Central Americans | 0.3 /100 | #271 | Tragic $38,560 |
| Immigrants | Cabo Verde | 0.3 /100 | #272 | Tragic $38,540 |
| Nepalese | 0.3 /100 | #273 | Tragic $38,442 |
| Immigrants | El Salvador | 0.3 /100 | #274 | Tragic $38,394 |
| Immigrants | Liberia | 0.2 /100 | #275 | Tragic $38,165 |
| Hmong | 0.2 /100 | #276 | Tragic $38,120 |
| Comanche | 0.2 /100 | #277 | Tragic $38,088 |
| Immigrants | Nicaragua | 0.2 /100 | #278 | Tragic $38,065 |
| Colville | 0.2 /100 | #279 | Tragic $38,047 |