Immigrants from Italy vs Immigrants from Cambodia Median Household Income
COMPARE
Immigrants from Italy
Immigrants from Cambodia
Median Household Income
Median Household Income Comparison
Immigrants from Italy
Immigrants from Cambodia
$93,465
MEDIAN HOUSEHOLD INCOME
99.5/ 100
METRIC RATING
75th/ 347
METRIC RANK
$83,304
MEDIAN HOUSEHOLD INCOME
24.0/ 100
METRIC RATING
203rd/ 347
METRIC RANK
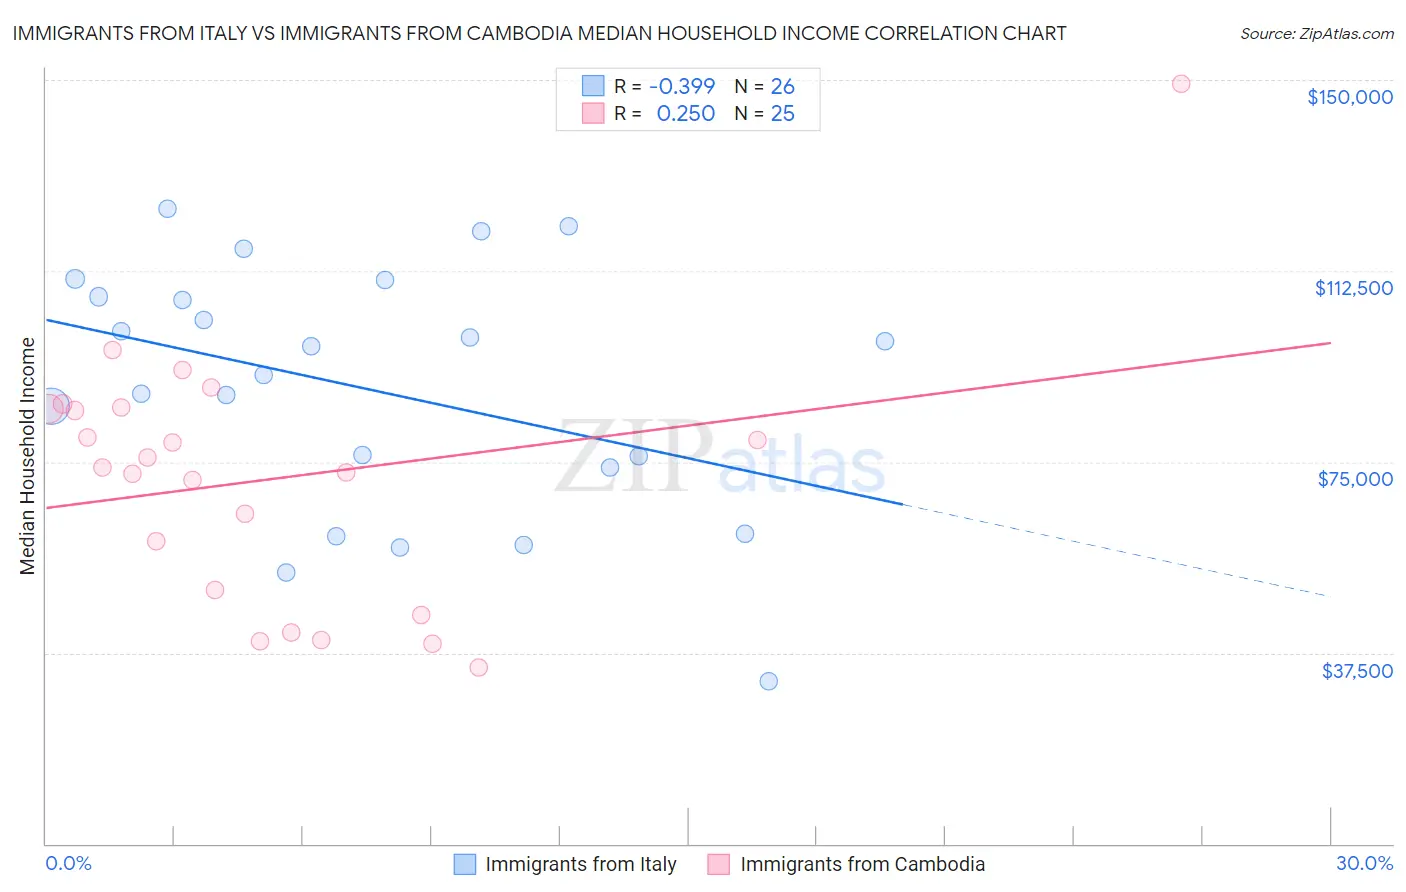
Immigrants from Italy vs Immigrants from Cambodia Median Household Income Correlation Chart
The statistical analysis conducted on geographies consisting of 324,128,900 people shows a mild negative correlation between the proportion of Immigrants from Italy and median household income in the United States with a correlation coefficient (R) of -0.399 and weighted average of $93,465. Similarly, the statistical analysis conducted on geographies consisting of 205,122,161 people shows a weak positive correlation between the proportion of Immigrants from Cambodia and median household income in the United States with a correlation coefficient (R) of 0.250 and weighted average of $83,304, a difference of 12.2%.
Median Household Income Correlation Summary
| Measurement | Immigrants from Italy | Immigrants from Cambodia |
| Minimum | $31,923 | $34,518 |
| Maximum | $124,607 | $149,239 |
| Range | $92,684 | $114,721 |
| Mean | $89,307 | $71,594 |
| Median | $94,900 | $73,842 |
| Interquartile 25% (IQ1) | $73,911 | $47,361 |
| Interquartile 75% (IQ3) | $107,408 | $85,484 |
| Interquartile Range (IQR) | $33,497 | $38,123 |
| Standard Deviation (Sample) | $24,372 | $25,130 |
| Standard Deviation (Population) | $23,899 | $24,622 |
Similar Demographics by Median Household Income
Demographics Similar to Immigrants from Italy by Median Household Income
In terms of median household income, the demographic groups most similar to Immigrants from Italy are South African ($93,379, a difference of 0.090%), Immigrants from Afghanistan ($93,375, a difference of 0.10%), Immigrants from Latvia ($93,602, a difference of 0.15%), Immigrants from Egypt ($93,700, a difference of 0.25%), and Immigrants from Bulgaria ($93,148, a difference of 0.34%).
| Demographics | Rating | Rank | Median Household Income |
| Mongolians | 99.7 /100 | #68 | Exceptional $93,971 |
| Argentineans | 99.7 /100 | #69 | Exceptional $93,960 |
| Immigrants | Fiji | 99.7 /100 | #70 | Exceptional $93,933 |
| Immigrants | Philippines | 99.6 /100 | #71 | Exceptional $93,899 |
| Lithuanians | 99.6 /100 | #72 | Exceptional $93,852 |
| Immigrants | Egypt | 99.6 /100 | #73 | Exceptional $93,700 |
| Immigrants | Latvia | 99.6 /100 | #74 | Exceptional $93,602 |
| Immigrants | Italy | 99.5 /100 | #75 | Exceptional $93,465 |
| South Africans | 99.5 /100 | #76 | Exceptional $93,379 |
| Immigrants | Afghanistan | 99.5 /100 | #77 | Exceptional $93,375 |
| Immigrants | Bulgaria | 99.4 /100 | #78 | Exceptional $93,148 |
| Sri Lankans | 99.4 /100 | #79 | Exceptional $93,093 |
| Tongans | 99.4 /100 | #80 | Exceptional $93,076 |
| Immigrants | Eastern Europe | 99.4 /100 | #81 | Exceptional $93,051 |
| Immigrants | Spain | 99.3 /100 | #82 | Exceptional $92,732 |
Demographics Similar to Immigrants from Cambodia by Median Household Income
In terms of median household income, the demographic groups most similar to Immigrants from Cambodia are Immigrants from Africa ($83,289, a difference of 0.020%), Immigrants from Thailand ($83,327, a difference of 0.030%), Tsimshian ($83,346, a difference of 0.050%), Spanish ($83,343, a difference of 0.050%), and German ($83,358, a difference of 0.070%).
| Demographics | Rating | Rank | Median Household Income |
| French | 26.0 /100 | #196 | Fair $83,468 |
| Aleuts | 25.7 /100 | #197 | Fair $83,446 |
| Japanese | 25.1 /100 | #198 | Fair $83,395 |
| Germans | 24.6 /100 | #199 | Fair $83,358 |
| Tsimshian | 24.5 /100 | #200 | Fair $83,346 |
| Spanish | 24.4 /100 | #201 | Fair $83,343 |
| Immigrants | Thailand | 24.3 /100 | #202 | Fair $83,327 |
| Immigrants | Cambodia | 24.0 /100 | #203 | Fair $83,304 |
| Immigrants | Africa | 23.8 /100 | #204 | Fair $83,289 |
| Celtics | 22.7 /100 | #205 | Fair $83,193 |
| Immigrants | Kenya | 21.3 /100 | #206 | Fair $83,068 |
| Dutch | 20.3 /100 | #207 | Fair $82,971 |
| French Canadians | 18.7 /100 | #208 | Poor $82,810 |
| Immigrants | Iraq | 16.7 /100 | #209 | Poor $82,594 |
| Immigrants | Uruguay | 16.4 /100 | #210 | Poor $82,560 |