Immigrants from Italy vs Immigrants from North America Median Household Income
COMPARE
Immigrants from Italy
Immigrants from North America
Median Household Income
Median Household Income Comparison
Immigrants from Italy
Immigrants from North America
$93,465
MEDIAN HOUSEHOLD INCOME
99.5/ 100
METRIC RATING
75th/ 347
METRIC RANK
$91,860
MEDIAN HOUSEHOLD INCOME
98.7/ 100
METRIC RATING
94th/ 347
METRIC RANK
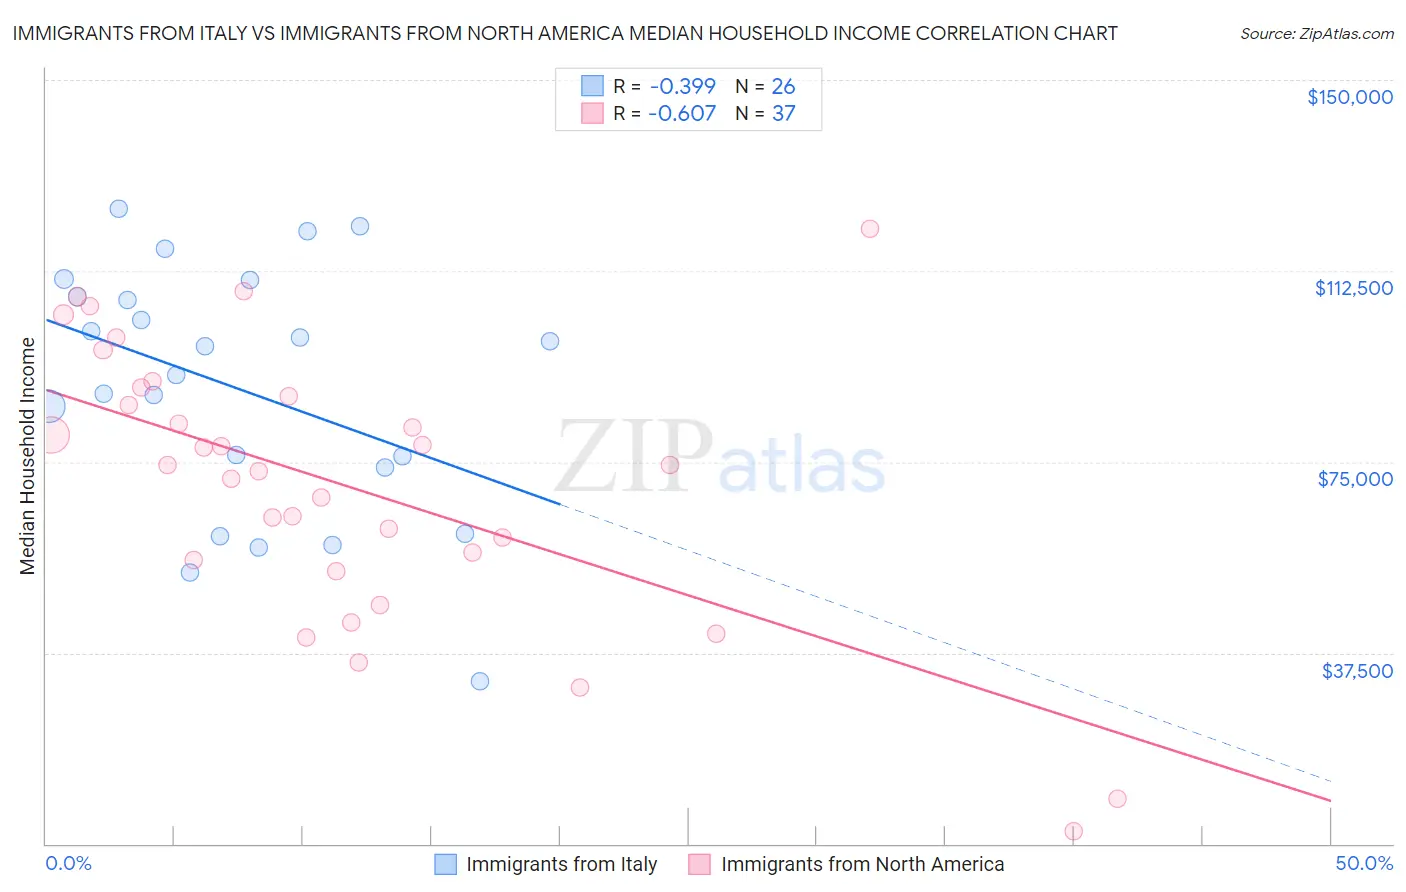
Immigrants from Italy vs Immigrants from North America Median Household Income Correlation Chart
The statistical analysis conducted on geographies consisting of 324,128,900 people shows a mild negative correlation between the proportion of Immigrants from Italy and median household income in the United States with a correlation coefficient (R) of -0.399 and weighted average of $93,465. Similarly, the statistical analysis conducted on geographies consisting of 462,084,352 people shows a significant negative correlation between the proportion of Immigrants from North America and median household income in the United States with a correlation coefficient (R) of -0.607 and weighted average of $91,860, a difference of 1.8%.
Median Household Income Correlation Summary
| Measurement | Immigrants from Italy | Immigrants from North America |
| Minimum | $31,923 | $2,499 |
| Maximum | $124,607 | $120,804 |
| Range | $92,684 | $118,305 |
| Mean | $89,307 | $70,374 |
| Median | $94,900 | $74,312 |
| Interquartile 25% (IQ1) | $73,911 | $54,648 |
| Interquartile 75% (IQ3) | $107,408 | $88,741 |
| Interquartile Range (IQR) | $33,497 | $34,094 |
| Standard Deviation (Sample) | $24,372 | $27,060 |
| Standard Deviation (Population) | $23,899 | $26,692 |
Demographics Similar to Immigrants from Italy and Immigrants from North America by Median Household Income
In terms of median household income, the demographic groups most similar to Immigrants from Italy are South African ($93,379, a difference of 0.090%), Immigrants from Afghanistan ($93,375, a difference of 0.10%), Immigrants from Latvia ($93,602, a difference of 0.15%), Immigrants from Bulgaria ($93,148, a difference of 0.34%), and Sri Lankan ($93,093, a difference of 0.40%). Similarly, the demographic groups most similar to Immigrants from North America are Immigrants from Lebanon ($91,887, a difference of 0.030%), Immigrants from Western Europe ($91,936, a difference of 0.080%), Assyrian/Chaldean/Syriac ($91,991, a difference of 0.14%), Immigrants from Vietnam ($91,987, a difference of 0.14%), and Romanian ($91,994, a difference of 0.15%).
| Demographics | Rating | Rank | Median Household Income |
| Immigrants | Latvia | 99.6 /100 | #74 | Exceptional $93,602 |
| Immigrants | Italy | 99.5 /100 | #75 | Exceptional $93,465 |
| South Africans | 99.5 /100 | #76 | Exceptional $93,379 |
| Immigrants | Afghanistan | 99.5 /100 | #77 | Exceptional $93,375 |
| Immigrants | Bulgaria | 99.4 /100 | #78 | Exceptional $93,148 |
| Sri Lankans | 99.4 /100 | #79 | Exceptional $93,093 |
| Tongans | 99.4 /100 | #80 | Exceptional $93,076 |
| Immigrants | Eastern Europe | 99.4 /100 | #81 | Exceptional $93,051 |
| Immigrants | Spain | 99.3 /100 | #82 | Exceptional $92,732 |
| Italians | 99.1 /100 | #83 | Exceptional $92,475 |
| Immigrants | Argentina | 99.1 /100 | #84 | Exceptional $92,417 |
| Immigrants | Croatia | 99.0 /100 | #85 | Exceptional $92,225 |
| Immigrants | England | 98.9 /100 | #86 | Exceptional $92,098 |
| Immigrants | Hungary | 98.9 /100 | #87 | Exceptional $92,094 |
| Immigrants | Canada | 98.8 /100 | #88 | Exceptional $92,029 |
| Romanians | 98.8 /100 | #89 | Exceptional $91,994 |
| Assyrians/Chaldeans/Syriacs | 98.8 /100 | #90 | Exceptional $91,991 |
| Immigrants | Vietnam | 98.8 /100 | #91 | Exceptional $91,987 |
| Immigrants | Western Europe | 98.8 /100 | #92 | Exceptional $91,936 |
| Immigrants | Lebanon | 98.7 /100 | #93 | Exceptional $91,887 |
| Immigrants | North America | 98.7 /100 | #94 | Exceptional $91,860 |