Immigrants from Italy vs Carpatho Rusyn Divorced or Separated
COMPARE
Immigrants from Italy
Carpatho Rusyn
Divorced or Separated
Divorced or Separated Comparison
Immigrants from Italy
Carpatho Rusyns
11.5%
DIVORCED OR SEPARATED
99.5/ 100
METRIC RATING
77th/ 347
METRIC RANK
11.9%
DIVORCED OR SEPARATED
84.8/ 100
METRIC RATING
136th/ 347
METRIC RANK
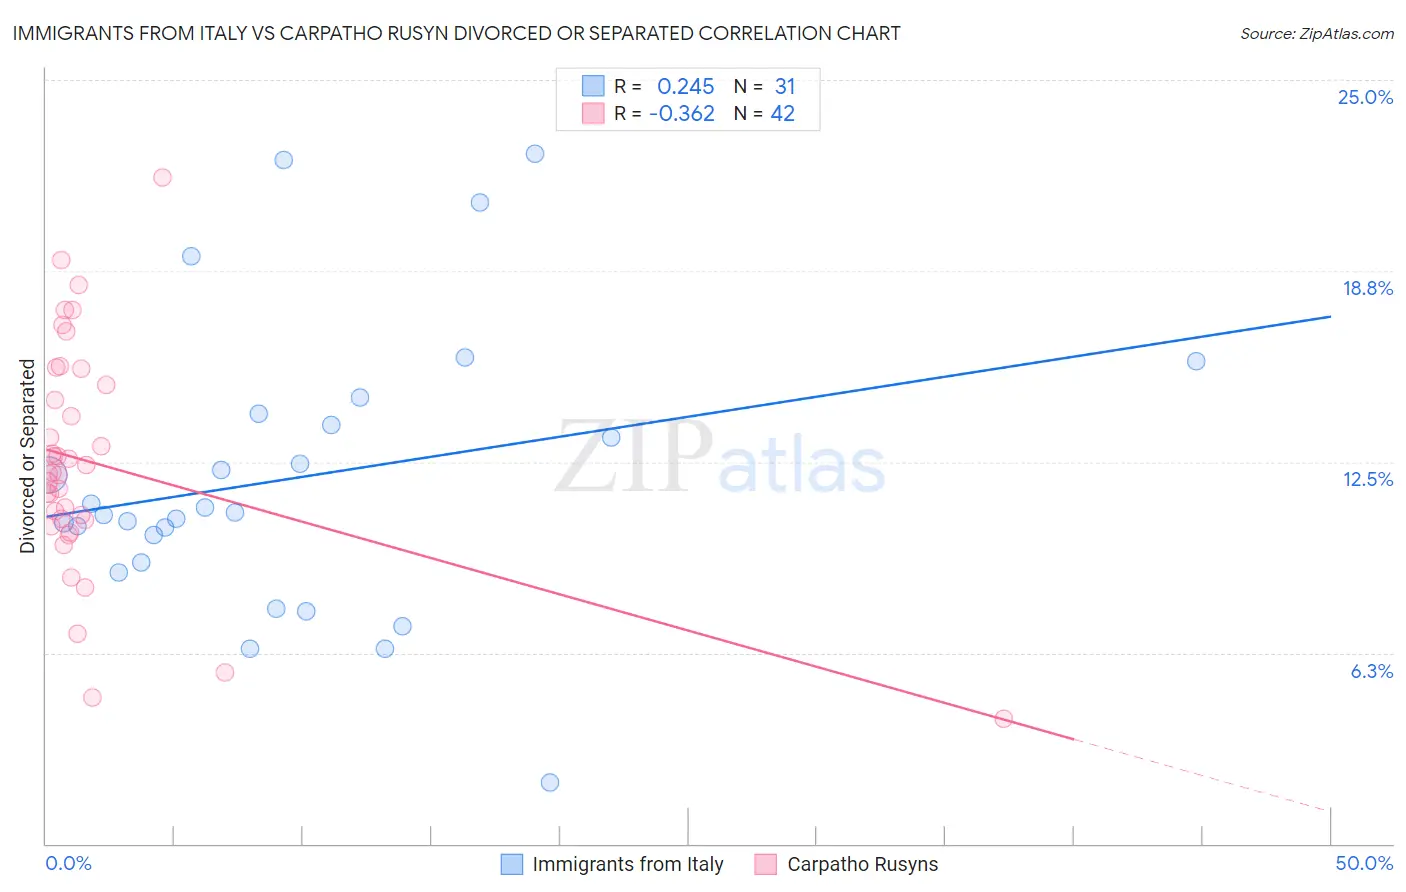
Immigrants from Italy vs Carpatho Rusyn Divorced or Separated Correlation Chart
The statistical analysis conducted on geographies consisting of 324,175,792 people shows a weak positive correlation between the proportion of Immigrants from Italy and percentage of population currently divorced or separated in the United States with a correlation coefficient (R) of 0.245 and weighted average of 11.5%. Similarly, the statistical analysis conducted on geographies consisting of 58,871,690 people shows a mild negative correlation between the proportion of Carpatho Rusyns and percentage of population currently divorced or separated in the United States with a correlation coefficient (R) of -0.362 and weighted average of 11.9%, a difference of 3.3%.
Divorced or Separated Correlation Summary
| Measurement | Immigrants from Italy | Carpatho Rusyn |
| Minimum | 2.0% | 4.1% |
| Maximum | 22.6% | 21.8% |
| Range | 20.6% | 17.7% |
| Mean | 12.0% | 12.5% |
| Median | 10.8% | 12.1% |
| Interquartile 25% (IQ1) | 9.2% | 10.6% |
| Interquartile 75% (IQ3) | 14.1% | 15.0% |
| Interquartile Range (IQR) | 4.9% | 4.4% |
| Standard Deviation (Sample) | 4.7% | 3.7% |
| Standard Deviation (Population) | 4.6% | 3.7% |
Similar Demographics by Divorced or Separated
Demographics Similar to Immigrants from Italy by Divorced or Separated
In terms of divorced or separated, the demographic groups most similar to Immigrants from Italy are Afghan (11.5%, a difference of 0.10%), Albanian (11.5%, a difference of 0.11%), Immigrants from Northern Africa (11.5%, a difference of 0.13%), Guyanese (11.5%, a difference of 0.14%), and Immigrants from Switzerland (11.5%, a difference of 0.16%).
| Demographics | Rating | Rank | Divorced or Separated |
| Immigrants | Eastern Europe | 99.7 /100 | #70 | Exceptional 11.5% |
| Paraguayans | 99.7 /100 | #71 | Exceptional 11.5% |
| Jordanians | 99.6 /100 | #72 | Exceptional 11.5% |
| Immigrants | North Macedonia | 99.6 /100 | #73 | Exceptional 11.5% |
| Taiwanese | 99.6 /100 | #74 | Exceptional 11.5% |
| Immigrants | Northern Africa | 99.6 /100 | #75 | Exceptional 11.5% |
| Albanians | 99.6 /100 | #76 | Exceptional 11.5% |
| Immigrants | Italy | 99.5 /100 | #77 | Exceptional 11.5% |
| Afghans | 99.4 /100 | #78 | Exceptional 11.5% |
| Guyanese | 99.4 /100 | #79 | Exceptional 11.5% |
| Immigrants | Switzerland | 99.4 /100 | #80 | Exceptional 11.5% |
| Russians | 99.4 /100 | #81 | Exceptional 11.5% |
| Immigrants | Romania | 99.3 /100 | #82 | Exceptional 11.5% |
| Immigrants | Bulgaria | 99.3 /100 | #83 | Exceptional 11.5% |
| Bulgarians | 99.3 /100 | #84 | Exceptional 11.5% |
Demographics Similar to Carpatho Rusyns by Divorced or Separated
In terms of divorced or separated, the demographic groups most similar to Carpatho Rusyns are Danish (11.9%, a difference of 0.0%), Argentinean (11.9%, a difference of 0.020%), Alsatian (11.9%, a difference of 0.060%), Immigrants from Netherlands (11.9%, a difference of 0.060%), and Australian (11.9%, a difference of 0.080%).
| Demographics | Rating | Rank | Divorced or Separated |
| Immigrants | St. Vincent and the Grenadines | 88.4 /100 | #129 | Excellent 11.8% |
| Immigrants | Austria | 88.2 /100 | #130 | Excellent 11.8% |
| Immigrants | Cambodia | 88.2 /100 | #131 | Excellent 11.8% |
| Immigrants | Afghanistan | 87.9 /100 | #132 | Excellent 11.8% |
| New Zealanders | 87.5 /100 | #133 | Excellent 11.9% |
| Argentineans | 85.1 /100 | #134 | Excellent 11.9% |
| Danes | 84.8 /100 | #135 | Excellent 11.9% |
| Carpatho Rusyns | 84.8 /100 | #136 | Excellent 11.9% |
| Alsatians | 84.0 /100 | #137 | Excellent 11.9% |
| Immigrants | Netherlands | 83.9 /100 | #138 | Excellent 11.9% |
| Australians | 83.6 /100 | #139 | Excellent 11.9% |
| Lebanese | 83.4 /100 | #140 | Excellent 11.9% |
| Immigrants | Morocco | 82.9 /100 | #141 | Excellent 11.9% |
| Immigrants | Zimbabwe | 81.5 /100 | #142 | Excellent 11.9% |
| Pakistanis | 81.3 /100 | #143 | Excellent 11.9% |