Immigrants from Czechoslovakia vs Indonesian Wage/Income Gap
COMPARE
Immigrants from Czechoslovakia
Indonesian
Wage/Income Gap
Wage/Income Gap Comparison
Immigrants from Czechoslovakia
Indonesians
27.3%
WAGE/INCOME GAP
2.7/ 100
METRIC RATING
250th/ 347
METRIC RANK
22.7%
WAGE/INCOME GAP
99.9/ 100
METRIC RATING
69th/ 347
METRIC RANK
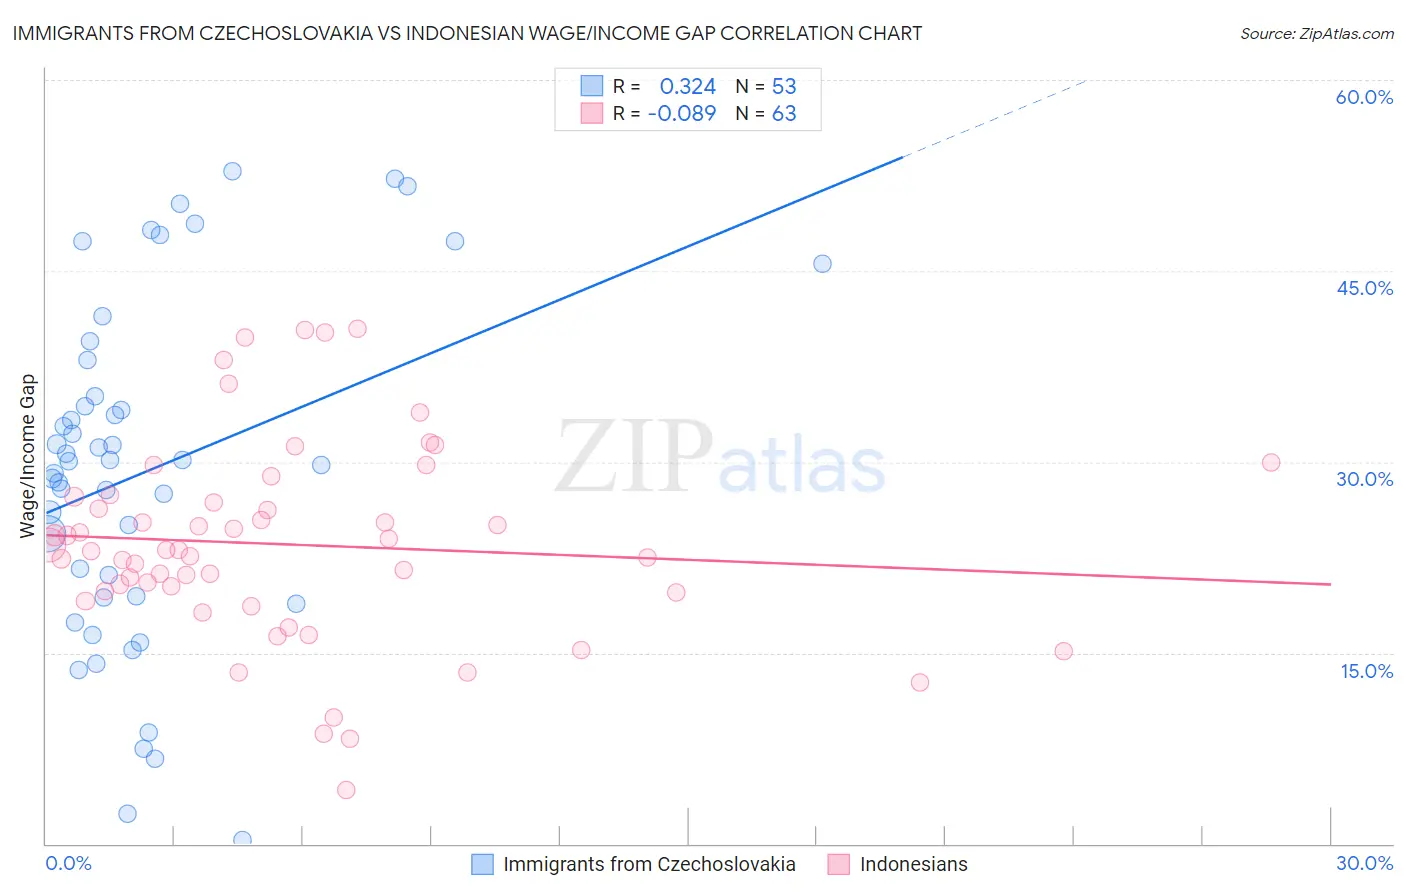
Immigrants from Czechoslovakia vs Indonesian Wage/Income Gap Correlation Chart
The statistical analysis conducted on geographies consisting of 195,414,700 people shows a mild positive correlation between the proportion of Immigrants from Czechoslovakia and wage/income gap percentage in the United States with a correlation coefficient (R) of 0.324 and weighted average of 27.3%. Similarly, the statistical analysis conducted on geographies consisting of 162,719,006 people shows a slight negative correlation between the proportion of Indonesians and wage/income gap percentage in the United States with a correlation coefficient (R) of -0.089 and weighted average of 22.7%, a difference of 20.0%.
Wage/Income Gap Correlation Summary
| Measurement | Immigrants from Czechoslovakia | Indonesian |
| Minimum | 0.26% | 4.2% |
| Maximum | 52.9% | 40.4% |
| Range | 52.6% | 36.2% |
| Mean | 29.3% | 23.5% |
| Median | 30.0% | 23.1% |
| Interquartile 25% (IQ1) | 19.4% | 19.8% |
| Interquartile 75% (IQ3) | 36.6% | 27.3% |
| Interquartile Range (IQR) | 17.2% | 7.5% |
| Standard Deviation (Sample) | 13.3% | 7.8% |
| Standard Deviation (Population) | 13.1% | 7.7% |
Similar Demographics by Wage/Income Gap
Demographics Similar to Immigrants from Czechoslovakia by Wage/Income Gap
In terms of wage/income gap, the demographic groups most similar to Immigrants from Czechoslovakia are Cypriot (27.3%, a difference of 0.020%), Carpatho Rusyn (27.3%, a difference of 0.020%), Celtic (27.3%, a difference of 0.030%), Immigrants from Norway (27.3%, a difference of 0.10%), and Ukrainian (27.3%, a difference of 0.16%).
| Demographics | Rating | Rank | Wage/Income Gap |
| Spanish | 3.6 /100 | #243 | Tragic 27.1% |
| Chickasaw | 3.5 /100 | #244 | Tragic 27.2% |
| Immigrants | Azores | 3.5 /100 | #245 | Tragic 27.2% |
| Immigrants | Nonimmigrants | 3.3 /100 | #246 | Tragic 27.2% |
| Celtics | 2.8 /100 | #247 | Tragic 27.3% |
| Cypriots | 2.8 /100 | #248 | Tragic 27.3% |
| Carpatho Rusyns | 2.7 /100 | #249 | Tragic 27.3% |
| Immigrants | Czechoslovakia | 2.7 /100 | #250 | Tragic 27.3% |
| Immigrants | Norway | 2.5 /100 | #251 | Tragic 27.3% |
| Ukrainians | 2.4 /100 | #252 | Tragic 27.3% |
| Portuguese | 2.2 /100 | #253 | Tragic 27.4% |
| Israelis | 2.1 /100 | #254 | Tragic 27.4% |
| Immigrants | France | 2.1 /100 | #255 | Tragic 27.4% |
| Cherokee | 1.9 /100 | #256 | Tragic 27.4% |
| Luxembourgers | 1.9 /100 | #257 | Tragic 27.4% |
Demographics Similar to Indonesians by Wage/Income Gap
In terms of wage/income gap, the demographic groups most similar to Indonesians are Immigrants from Nigeria (22.7%, a difference of 0.030%), Menominee (22.7%, a difference of 0.040%), Immigrants from Uzbekistan (22.7%, a difference of 0.11%), Central American Indian (22.7%, a difference of 0.21%), and Immigrants from El Salvador (22.8%, a difference of 0.28%).
| Demographics | Rating | Rank | Wage/Income Gap |
| Immigrants | Guatemala | 100.0 /100 | #62 | Exceptional 22.5% |
| Immigrants | Ecuador | 100.0 /100 | #63 | Exceptional 22.5% |
| Spanish American Indians | 100.0 /100 | #64 | Exceptional 22.5% |
| Guatemalans | 99.9 /100 | #65 | Exceptional 22.6% |
| Central American Indians | 99.9 /100 | #66 | Exceptional 22.7% |
| Menominee | 99.9 /100 | #67 | Exceptional 22.7% |
| Immigrants | Nigeria | 99.9 /100 | #68 | Exceptional 22.7% |
| Indonesians | 99.9 /100 | #69 | Exceptional 22.7% |
| Immigrants | Uzbekistan | 99.9 /100 | #70 | Exceptional 22.7% |
| Immigrants | El Salvador | 99.9 /100 | #71 | Exceptional 22.8% |
| Sub-Saharan Africans | 99.9 /100 | #72 | Exceptional 22.8% |
| Immigrants | Eastern Africa | 99.9 /100 | #73 | Exceptional 22.8% |
| Immigrants | Burma/Myanmar | 99.9 /100 | #74 | Exceptional 22.8% |
| Fijians | 99.9 /100 | #75 | Exceptional 22.9% |
| Ecuadorians | 99.9 /100 | #76 | Exceptional 22.9% |