Immigrants from Iraq vs Choctaw Median Earnings
COMPARE
Immigrants from Iraq
Choctaw
Median Earnings
Median Earnings Comparison
Immigrants from Iraq
Choctaw
$44,988
MEDIAN EARNINGS
11.6/ 100
METRIC RATING
228th/ 347
METRIC RANK
$40,270
MEDIAN EARNINGS
0.0/ 100
METRIC RATING
313th/ 347
METRIC RANK
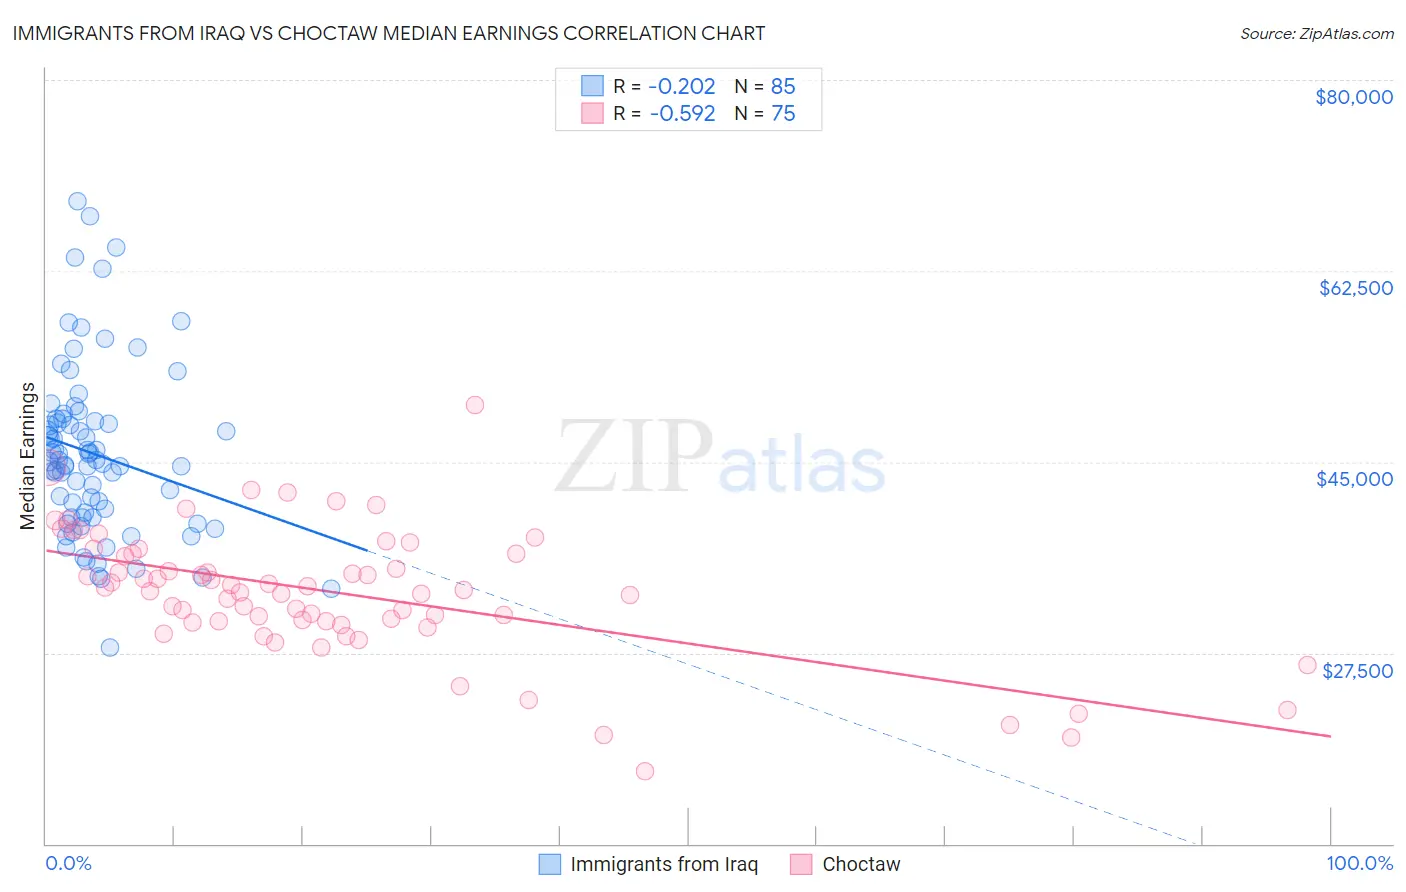
Immigrants from Iraq vs Choctaw Median Earnings Correlation Chart
The statistical analysis conducted on geographies consisting of 194,784,427 people shows a weak negative correlation between the proportion of Immigrants from Iraq and median earnings in the United States with a correlation coefficient (R) of -0.202 and weighted average of $44,988. Similarly, the statistical analysis conducted on geographies consisting of 269,709,236 people shows a substantial negative correlation between the proportion of Choctaw and median earnings in the United States with a correlation coefficient (R) of -0.592 and weighted average of $40,270, a difference of 11.7%.
Median Earnings Correlation Summary
| Measurement | Immigrants from Iraq | Choctaw |
| Minimum | $27,932 | $16,607 |
| Maximum | $68,937 | $50,240 |
| Range | $41,005 | $33,633 |
| Mean | $45,692 | $33,003 |
| Median | $45,037 | $33,256 |
| Interquartile 25% (IQ1) | $39,916 | $30,391 |
| Interquartile 75% (IQ3) | $48,838 | $36,563 |
| Interquartile Range (IQR) | $8,923 | $6,172 |
| Standard Deviation (Sample) | $7,829 | $5,920 |
| Standard Deviation (Population) | $7,782 | $5,880 |
Similar Demographics by Median Earnings
Demographics Similar to Immigrants from Iraq by Median Earnings
In terms of median earnings, the demographic groups most similar to Immigrants from Iraq are Immigrants from Nigeria ($45,030, a difference of 0.090%), Native Hawaiian ($45,027, a difference of 0.090%), Scotch-Irish ($44,924, a difference of 0.14%), Immigrants from Western Africa ($44,893, a difference of 0.21%), and Immigrants from Cambodia ($45,090, a difference of 0.22%).
| Demographics | Rating | Rank | Median Earnings |
| Immigrants | Guyana | 15.1 /100 | #221 | Poor $45,204 |
| Immigrants | Panama | 15.0 /100 | #222 | Poor $45,198 |
| Whites/Caucasians | 15.0 /100 | #223 | Poor $45,197 |
| West Indians | 13.9 /100 | #224 | Poor $45,132 |
| Immigrants | Cambodia | 13.2 /100 | #225 | Poor $45,090 |
| Immigrants | Nigeria | 12.2 /100 | #226 | Poor $45,030 |
| Native Hawaiians | 12.2 /100 | #227 | Poor $45,027 |
| Immigrants | Iraq | 11.6 /100 | #228 | Poor $44,988 |
| Scotch-Irish | 10.7 /100 | #229 | Poor $44,924 |
| Immigrants | Western Africa | 10.3 /100 | #230 | Poor $44,893 |
| Japanese | 9.5 /100 | #231 | Tragic $44,825 |
| Delaware | 9.0 /100 | #232 | Tragic $44,783 |
| Immigrants | Sudan | 8.8 /100 | #233 | Tragic $44,767 |
| Cape Verdeans | 7.5 /100 | #234 | Tragic $44,640 |
| Venezuelans | 6.9 /100 | #235 | Tragic $44,580 |
Demographics Similar to Choctaw by Median Earnings
In terms of median earnings, the demographic groups most similar to Choctaw are Hispanic or Latino ($40,288, a difference of 0.040%), Chippewa ($40,287, a difference of 0.040%), Cheyenne ($40,233, a difference of 0.090%), Seminole ($40,233, a difference of 0.090%), and Immigrants from Honduras ($40,195, a difference of 0.19%).
| Demographics | Rating | Rank | Median Earnings |
| Yaqui | 0.0 /100 | #306 | Tragic $40,647 |
| Hondurans | 0.0 /100 | #307 | Tragic $40,638 |
| Cubans | 0.0 /100 | #308 | Tragic $40,619 |
| Immigrants | Haiti | 0.0 /100 | #309 | Tragic $40,550 |
| Apache | 0.0 /100 | #310 | Tragic $40,388 |
| Hispanics or Latinos | 0.0 /100 | #311 | Tragic $40,288 |
| Chippewa | 0.0 /100 | #312 | Tragic $40,287 |
| Choctaw | 0.0 /100 | #313 | Tragic $40,270 |
| Cheyenne | 0.0 /100 | #314 | Tragic $40,233 |
| Seminole | 0.0 /100 | #315 | Tragic $40,233 |
| Immigrants | Honduras | 0.0 /100 | #316 | Tragic $40,195 |
| Fijians | 0.0 /100 | #317 | Tragic $40,193 |
| Dutch West Indians | 0.0 /100 | #318 | Tragic $40,107 |
| Blacks/African Americans | 0.0 /100 | #319 | Tragic $40,085 |
| Immigrants | Bahamas | 0.0 /100 | #320 | Tragic $39,861 |