Immigrants from Indonesia vs Immigrants from Saudi Arabia Median Earnings
COMPARE
Immigrants from Indonesia
Immigrants from Saudi Arabia
Median Earnings
Median Earnings Comparison
Immigrants from Indonesia
Immigrants from Saudi Arabia
$51,715
MEDIAN EARNINGS
99.9/ 100
METRIC RATING
54th/ 347
METRIC RANK
$47,704
MEDIAN EARNINGS
85.6/ 100
METRIC RATING
145th/ 347
METRIC RANK
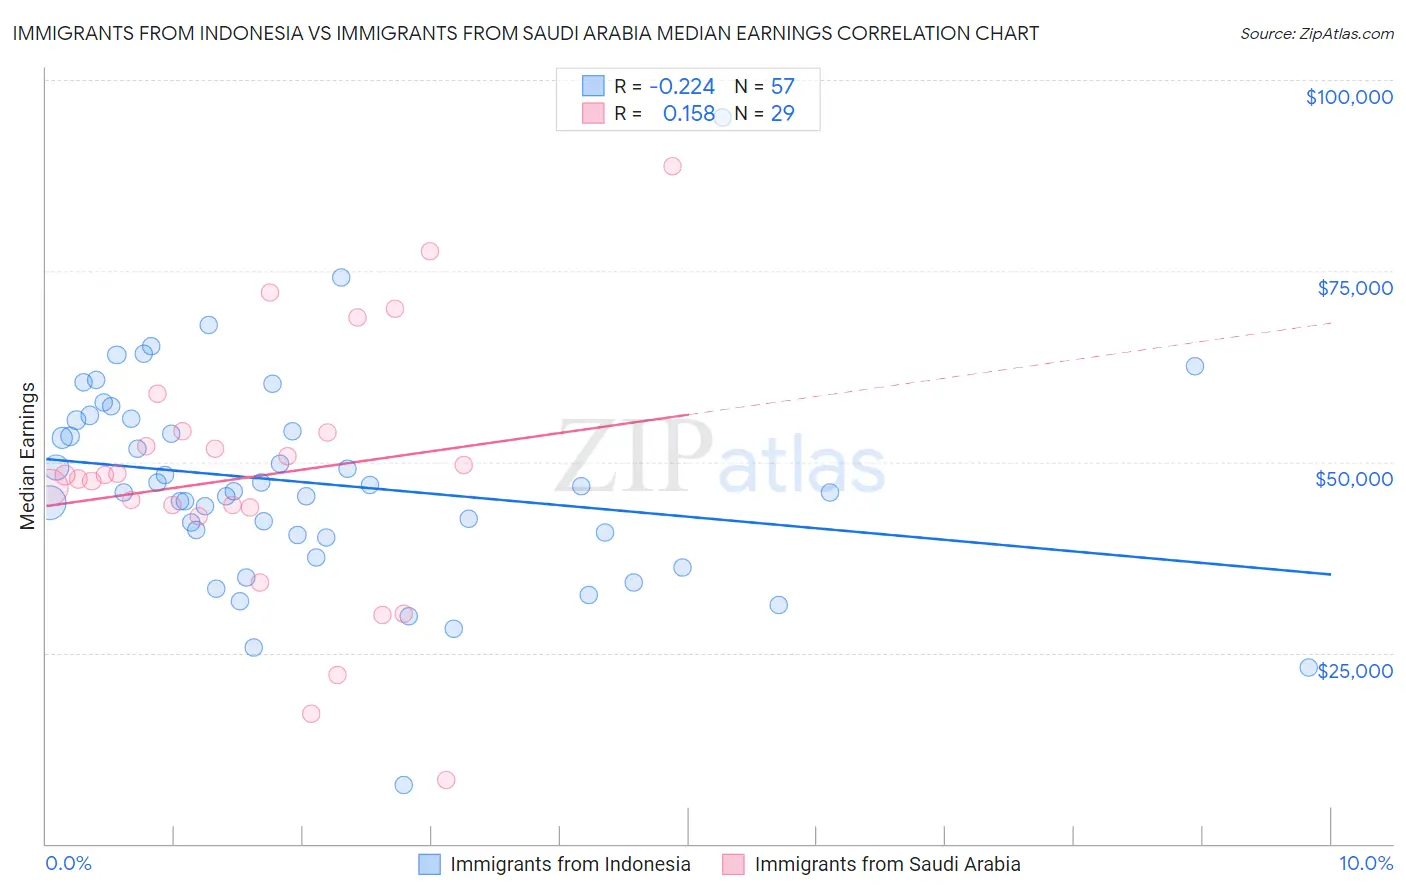
Immigrants from Indonesia vs Immigrants from Saudi Arabia Median Earnings Correlation Chart
The statistical analysis conducted on geographies consisting of 215,769,238 people shows a weak negative correlation between the proportion of Immigrants from Indonesia and median earnings in the United States with a correlation coefficient (R) of -0.224 and weighted average of $51,715. Similarly, the statistical analysis conducted on geographies consisting of 164,295,886 people shows a poor positive correlation between the proportion of Immigrants from Saudi Arabia and median earnings in the United States with a correlation coefficient (R) of 0.158 and weighted average of $47,704, a difference of 8.4%.
Median Earnings Correlation Summary
| Measurement | Immigrants from Indonesia | Immigrants from Saudi Arabia |
| Minimum | $7,703 | $8,283 |
| Maximum | $95,117 | $88,678 |
| Range | $87,414 | $80,395 |
| Mean | $47,201 | $48,188 |
| Median | $46,101 | $48,225 |
| Interquartile 25% (IQ1) | $40,269 | $43,477 |
| Interquartile 75% (IQ3) | $55,574 | $53,983 |
| Interquartile Range (IQR) | $15,305 | $10,507 |
| Standard Deviation (Sample) | $13,842 | $17,307 |
| Standard Deviation (Population) | $13,720 | $17,006 |
Similar Demographics by Median Earnings
Demographics Similar to Immigrants from Indonesia by Median Earnings
In terms of median earnings, the demographic groups most similar to Immigrants from Indonesia are Egyptian ($51,701, a difference of 0.030%), Immigrants from Pakistan ($51,693, a difference of 0.040%), Immigrants from Norway ($51,758, a difference of 0.080%), Estonian ($51,772, a difference of 0.11%), and Immigrants from Eastern Europe ($51,624, a difference of 0.18%).
| Demographics | Rating | Rank | Median Earnings |
| Australians | 100.0 /100 | #47 | Exceptional $52,294 |
| Immigrants | Europe | 100.0 /100 | #48 | Exceptional $52,195 |
| Bolivians | 100.0 /100 | #49 | Exceptional $52,005 |
| Immigrants | South Africa | 100.0 /100 | #50 | Exceptional $51,850 |
| Immigrants | Austria | 99.9 /100 | #51 | Exceptional $51,826 |
| Estonians | 99.9 /100 | #52 | Exceptional $51,772 |
| Immigrants | Norway | 99.9 /100 | #53 | Exceptional $51,758 |
| Immigrants | Indonesia | 99.9 /100 | #54 | Exceptional $51,715 |
| Egyptians | 99.9 /100 | #55 | Exceptional $51,701 |
| Immigrants | Pakistan | 99.9 /100 | #56 | Exceptional $51,693 |
| Immigrants | Eastern Europe | 99.9 /100 | #57 | Exceptional $51,624 |
| Immigrants | Bolivia | 99.9 /100 | #58 | Exceptional $51,605 |
| Immigrants | Croatia | 99.9 /100 | #59 | Exceptional $51,581 |
| Immigrants | Serbia | 99.9 /100 | #60 | Exceptional $51,557 |
| Immigrants | Latvia | 99.9 /100 | #61 | Exceptional $51,555 |
Demographics Similar to Immigrants from Saudi Arabia by Median Earnings
In terms of median earnings, the demographic groups most similar to Immigrants from Saudi Arabia are Immigrants from Chile ($47,697, a difference of 0.010%), Immigrants from South Eastern Asia ($47,671, a difference of 0.070%), Immigrants from Eritrea ($47,657, a difference of 0.10%), Luxembourger ($47,640, a difference of 0.14%), and Peruvian ($47,628, a difference of 0.16%).
| Demographics | Rating | Rank | Median Earnings |
| Europeans | 88.9 /100 | #138 | Excellent $47,915 |
| Canadians | 88.8 /100 | #139 | Excellent $47,911 |
| Taiwanese | 88.7 /100 | #140 | Excellent $47,902 |
| Immigrants | Sierra Leone | 88.3 /100 | #141 | Excellent $47,875 |
| Ugandans | 88.0 /100 | #142 | Excellent $47,854 |
| Swedes | 88.0 /100 | #143 | Excellent $47,851 |
| Hungarians | 87.1 /100 | #144 | Excellent $47,795 |
| Immigrants | Saudi Arabia | 85.6 /100 | #145 | Excellent $47,704 |
| Immigrants | Chile | 85.5 /100 | #146 | Excellent $47,697 |
| Immigrants | South Eastern Asia | 85.0 /100 | #147 | Excellent $47,671 |
| Immigrants | Eritrea | 84.8 /100 | #148 | Excellent $47,657 |
| Luxembourgers | 84.5 /100 | #149 | Excellent $47,640 |
| Peruvians | 84.2 /100 | #150 | Excellent $47,628 |
| Immigrants | Oceania | 84.1 /100 | #151 | Excellent $47,617 |
| Immigrants | Germany | 83.1 /100 | #152 | Excellent $47,566 |