Immigrants from Indonesia vs Israeli Median Earnings
COMPARE
Immigrants from Indonesia
Israeli
Median Earnings
Median Earnings Comparison
Immigrants from Indonesia
Israelis
$51,715
MEDIAN EARNINGS
99.9/ 100
METRIC RATING
54th/ 347
METRIC RANK
$52,937
MEDIAN EARNINGS
100.0/ 100
METRIC RATING
40th/ 347
METRIC RANK
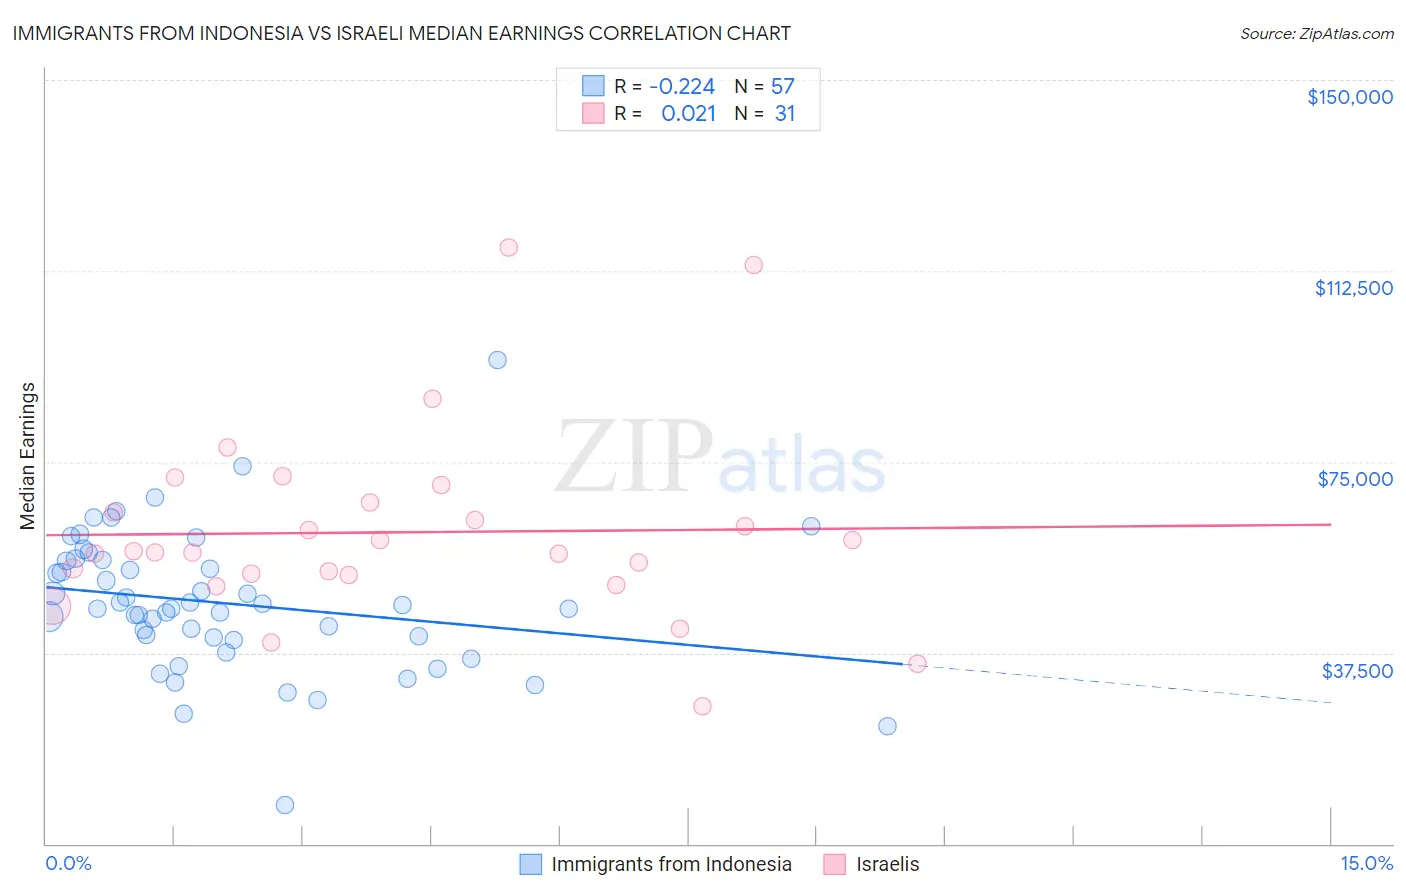
Immigrants from Indonesia vs Israeli Median Earnings Correlation Chart
The statistical analysis conducted on geographies consisting of 215,769,238 people shows a weak negative correlation between the proportion of Immigrants from Indonesia and median earnings in the United States with a correlation coefficient (R) of -0.224 and weighted average of $51,715. Similarly, the statistical analysis conducted on geographies consisting of 211,215,841 people shows no correlation between the proportion of Israelis and median earnings in the United States with a correlation coefficient (R) of 0.021 and weighted average of $52,937, a difference of 2.4%.
Median Earnings Correlation Summary
| Measurement | Immigrants from Indonesia | Israeli |
| Minimum | $7,703 | $27,000 |
| Maximum | $95,117 | $117,019 |
| Range | $87,414 | $90,019 |
| Mean | $47,201 | $61,168 |
| Median | $46,101 | $57,256 |
| Interquartile 25% (IQ1) | $40,269 | $52,851 |
| Interquartile 75% (IQ3) | $55,574 | $67,052 |
| Interquartile Range (IQR) | $15,305 | $14,202 |
| Standard Deviation (Sample) | $13,842 | $18,863 |
| Standard Deviation (Population) | $13,720 | $18,557 |
Demographics Similar to Immigrants from Indonesia and Israelis by Median Earnings
In terms of median earnings, the demographic groups most similar to Immigrants from Indonesia are Egyptian ($51,701, a difference of 0.030%), Immigrants from Pakistan ($51,693, a difference of 0.040%), Immigrants from Norway ($51,758, a difference of 0.080%), Estonian ($51,772, a difference of 0.11%), and Immigrants from Eastern Europe ($51,624, a difference of 0.18%). Similarly, the demographic groups most similar to Israelis are Immigrants from Turkey ($52,960, a difference of 0.040%), Latvian ($53,001, a difference of 0.12%), Immigrants from Belarus ($53,043, a difference of 0.20%), Immigrants from Lithuania ($52,769, a difference of 0.32%), and Maltese ($52,526, a difference of 0.78%).
| Demographics | Rating | Rank | Median Earnings |
| Immigrants | Belarus | 100.0 /100 | #37 | Exceptional $53,043 |
| Latvians | 100.0 /100 | #38 | Exceptional $53,001 |
| Immigrants | Turkey | 100.0 /100 | #39 | Exceptional $52,960 |
| Israelis | 100.0 /100 | #40 | Exceptional $52,937 |
| Immigrants | Lithuania | 100.0 /100 | #41 | Exceptional $52,769 |
| Maltese | 100.0 /100 | #42 | Exceptional $52,526 |
| Immigrants | Malaysia | 100.0 /100 | #43 | Exceptional $52,514 |
| Bulgarians | 100.0 /100 | #44 | Exceptional $52,512 |
| Immigrants | Czechoslovakia | 100.0 /100 | #45 | Exceptional $52,361 |
| Bhutanese | 100.0 /100 | #46 | Exceptional $52,297 |
| Australians | 100.0 /100 | #47 | Exceptional $52,294 |
| Immigrants | Europe | 100.0 /100 | #48 | Exceptional $52,195 |
| Bolivians | 100.0 /100 | #49 | Exceptional $52,005 |
| Immigrants | South Africa | 100.0 /100 | #50 | Exceptional $51,850 |
| Immigrants | Austria | 99.9 /100 | #51 | Exceptional $51,826 |
| Estonians | 99.9 /100 | #52 | Exceptional $51,772 |
| Immigrants | Norway | 99.9 /100 | #53 | Exceptional $51,758 |
| Immigrants | Indonesia | 99.9 /100 | #54 | Exceptional $51,715 |
| Egyptians | 99.9 /100 | #55 | Exceptional $51,701 |
| Immigrants | Pakistan | 99.9 /100 | #56 | Exceptional $51,693 |
| Immigrants | Eastern Europe | 99.9 /100 | #57 | Exceptional $51,624 |