Immigrants from Hungary vs British In Labor Force | Age 20-64
COMPARE
Immigrants from Hungary
British
In Labor Force | Age 20-64
In Labor Force | Age 20-64 Comparison
Immigrants from Hungary
British
79.5%
IN LABOR FORCE | AGE 20-64
36.8/ 100
METRIC RATING
183rd/ 347
METRIC RANK
79.3%
IN LABOR FORCE | AGE 20-64
16.5/ 100
METRIC RATING
208th/ 347
METRIC RANK
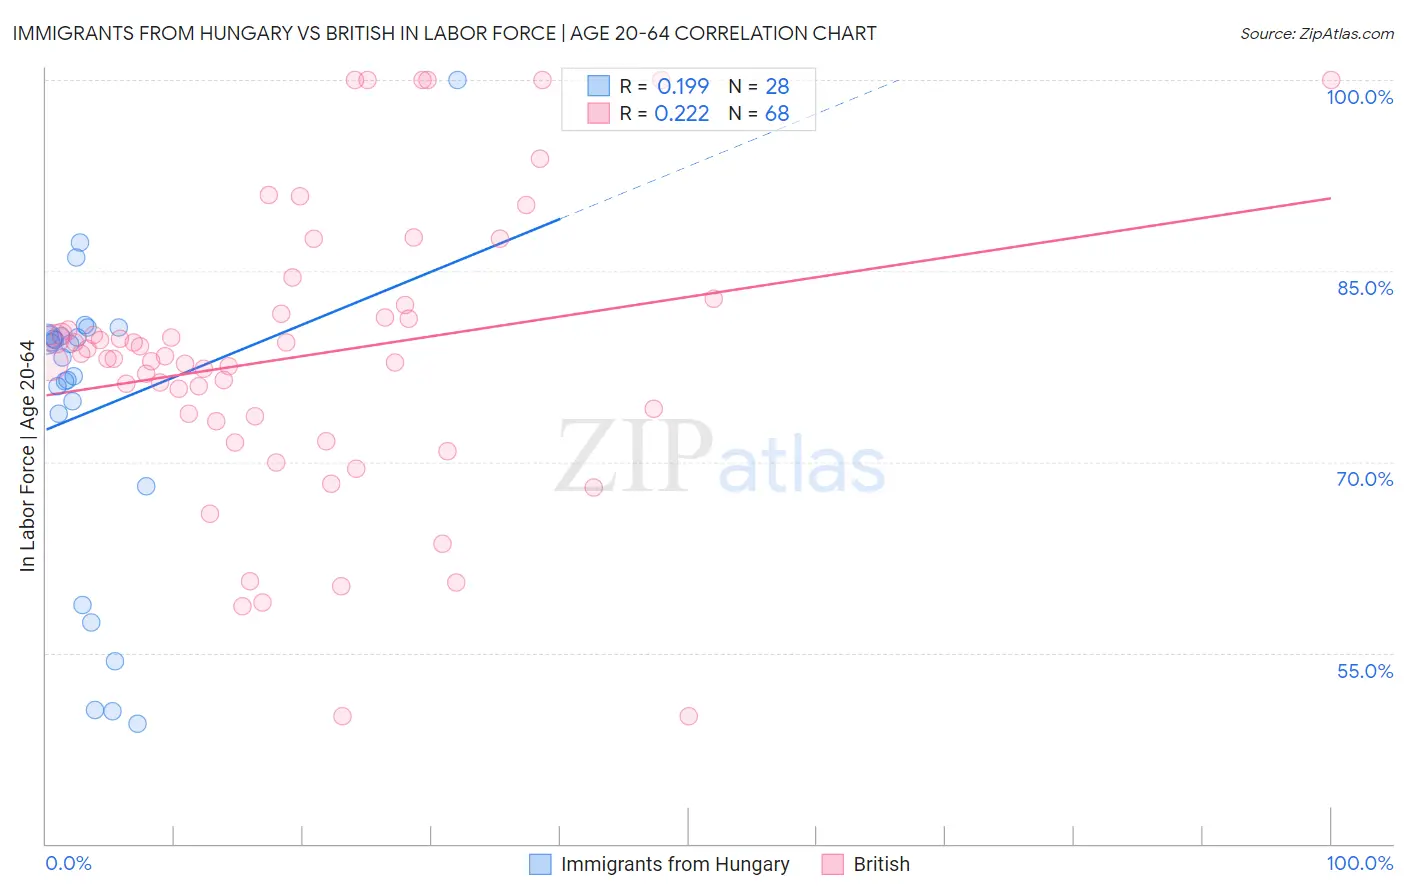
Immigrants from Hungary vs British In Labor Force | Age 20-64 Correlation Chart
The statistical analysis conducted on geographies consisting of 195,708,395 people shows a poor positive correlation between the proportion of Immigrants from Hungary and labor force participation rate among population between the ages 20 and 64 in the United States with a correlation coefficient (R) of 0.199 and weighted average of 79.5%. Similarly, the statistical analysis conducted on geographies consisting of 531,500,819 people shows a weak positive correlation between the proportion of British and labor force participation rate among population between the ages 20 and 64 in the United States with a correlation coefficient (R) of 0.222 and weighted average of 79.3%, a difference of 0.22%.
In Labor Force | Age 20-64 Correlation Summary
| Measurement | Immigrants from Hungary | British |
| Minimum | 49.4% | 50.0% |
| Maximum | 100.0% | 100.0% |
| Range | 50.6% | 50.0% |
| Mean | 74.1% | 78.3% |
| Median | 78.7% | 78.2% |
| Interquartile 25% (IQ1) | 70.9% | 73.4% |
| Interquartile 75% (IQ3) | 79.9% | 81.9% |
| Interquartile Range (IQR) | 9.0% | 8.6% |
| Standard Deviation (Sample) | 12.3% | 11.4% |
| Standard Deviation (Population) | 12.1% | 11.3% |
Similar Demographics by In Labor Force | Age 20-64
Demographics Similar to Immigrants from Hungary by In Labor Force | Age 20-64
In terms of in labor force | age 20-64, the demographic groups most similar to Immigrants from Hungary are Malaysian (79.5%, a difference of 0.0%), Immigrants from Saudi Arabia (79.5%, a difference of 0.010%), Finnish (79.5%, a difference of 0.010%), Israeli (79.5%, a difference of 0.020%), and Northern European (79.5%, a difference of 0.020%).
| Demographics | Rating | Rank | In Labor Force | Age 20-64 |
| Australians | 46.0 /100 | #176 | Average 79.5% |
| Immigrants | Netherlands | 45.2 /100 | #177 | Average 79.5% |
| Czechoslovakians | 44.3 /100 | #178 | Average 79.5% |
| Armenians | 41.4 /100 | #179 | Average 79.5% |
| Salvadorans | 41.0 /100 | #180 | Average 79.5% |
| Immigrants | Saudi Arabia | 37.7 /100 | #181 | Fair 79.5% |
| Malaysians | 37.1 /100 | #182 | Fair 79.5% |
| Immigrants | Hungary | 36.8 /100 | #183 | Fair 79.5% |
| Finns | 35.9 /100 | #184 | Fair 79.5% |
| Israelis | 34.7 /100 | #185 | Fair 79.5% |
| Northern Europeans | 34.5 /100 | #186 | Fair 79.5% |
| Assyrians/Chaldeans/Syriacs | 33.3 /100 | #187 | Fair 79.4% |
| Immigrants | Haiti | 32.1 /100 | #188 | Fair 79.4% |
| Immigrants | El Salvador | 30.9 /100 | #189 | Fair 79.4% |
| Immigrants | Syria | 30.8 /100 | #190 | Fair 79.4% |
Demographics Similar to British by In Labor Force | Age 20-64
In terms of in labor force | age 20-64, the demographic groups most similar to British are Subsaharan African (79.3%, a difference of 0.0%), Bangladeshi (79.3%, a difference of 0.0%), Immigrants from Ecuador (79.3%, a difference of 0.010%), Haitian (79.3%, a difference of 0.010%), and Iraqi (79.3%, a difference of 0.020%).
| Demographics | Rating | Rank | In Labor Force | Age 20-64 |
| Immigrants | Nicaragua | 19.0 /100 | #201 | Poor 79.3% |
| Nicaraguans | 18.3 /100 | #202 | Poor 79.3% |
| Iraqis | 17.7 /100 | #203 | Poor 79.3% |
| Immigrants | Cambodia | 17.6 /100 | #204 | Poor 79.3% |
| Immigrants | Congo | 17.5 /100 | #205 | Poor 79.3% |
| Immigrants | Ecuador | 16.9 /100 | #206 | Poor 79.3% |
| Sub-Saharan Africans | 16.5 /100 | #207 | Poor 79.3% |
| British | 16.5 /100 | #208 | Poor 79.3% |
| Bangladeshis | 16.4 /100 | #209 | Poor 79.3% |
| Haitians | 16.1 /100 | #210 | Poor 79.3% |
| Europeans | 15.3 /100 | #211 | Poor 79.3% |
| Irish | 13.2 /100 | #212 | Poor 79.3% |
| Immigrants | Portugal | 12.8 /100 | #213 | Poor 79.3% |
| Immigrants | Armenia | 12.2 /100 | #214 | Poor 79.2% |
| Immigrants | Norway | 12.0 /100 | #215 | Poor 79.2% |