Immigrants from Honduras vs Moroccan Median Family Income
COMPARE
Immigrants from Honduras
Moroccan
Median Family Income
Median Family Income Comparison
Immigrants from Honduras
Moroccans
$83,618
MEDIAN FAMILY INCOME
0.0/ 100
METRIC RATING
319th/ 347
METRIC RANK
$104,488
MEDIAN FAMILY INCOME
71.6/ 100
METRIC RATING
157th/ 347
METRIC RANK
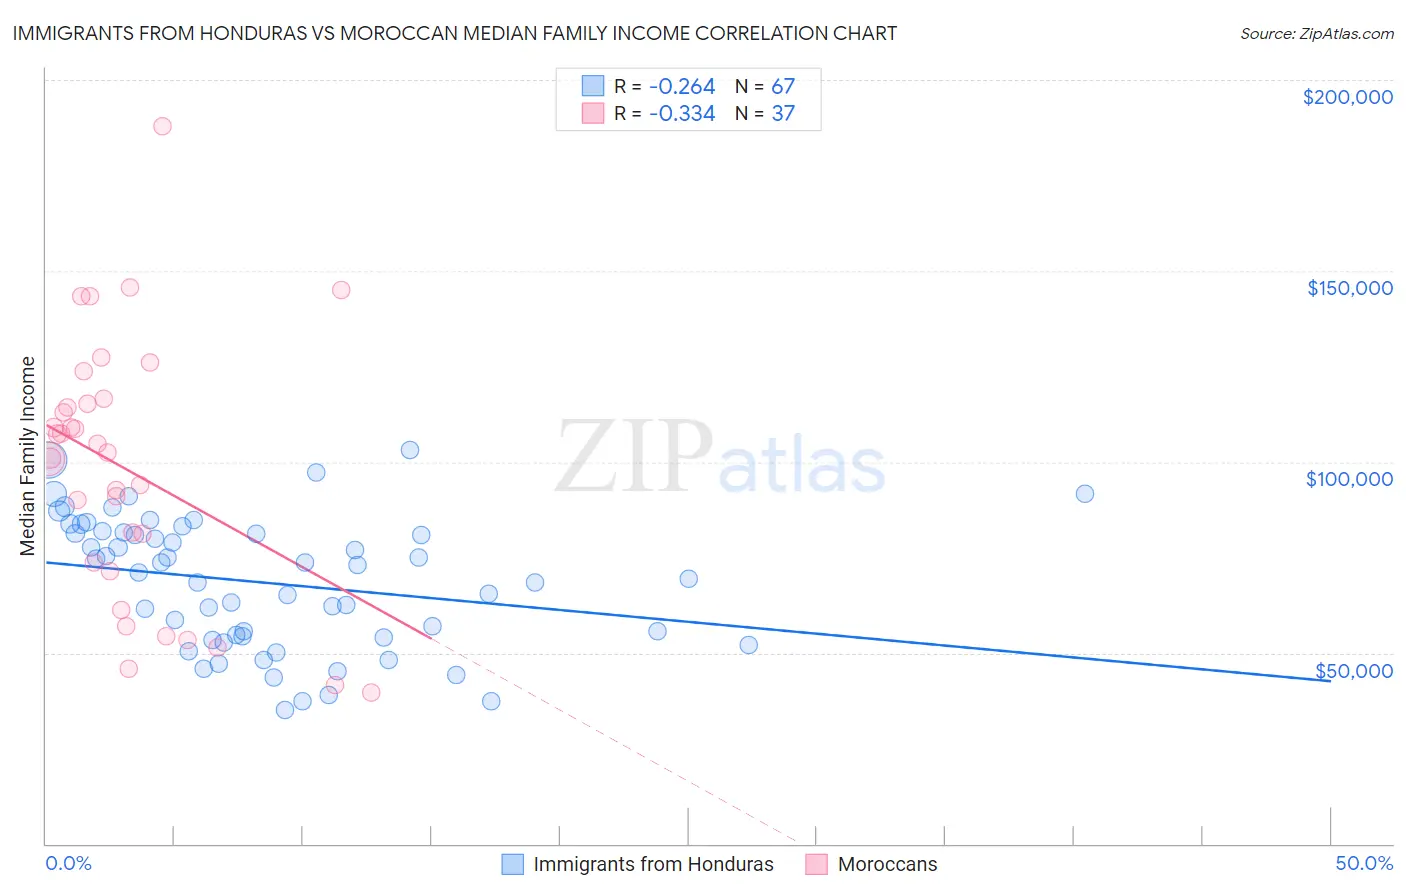
Immigrants from Honduras vs Moroccan Median Family Income Correlation Chart
The statistical analysis conducted on geographies consisting of 322,401,068 people shows a weak negative correlation between the proportion of Immigrants from Honduras and median family income in the United States with a correlation coefficient (R) of -0.264 and weighted average of $83,618. Similarly, the statistical analysis conducted on geographies consisting of 201,715,101 people shows a mild negative correlation between the proportion of Moroccans and median family income in the United States with a correlation coefficient (R) of -0.334 and weighted average of $104,488, a difference of 25.0%.
Median Family Income Correlation Summary
| Measurement | Immigrants from Honduras | Moroccan |
| Minimum | $34,952 | $39,712 |
| Maximum | $103,059 | $187,788 |
| Range | $68,107 | $148,076 |
| Mean | $68,333 | $98,112 |
| Median | $70,983 | $102,324 |
| Interquartile 25% (IQ1) | $53,890 | $72,461 |
| Interquartile 75% (IQ3) | $81,453 | $115,754 |
| Interquartile Range (IQR) | $27,563 | $43,293 |
| Standard Deviation (Sample) | $17,040 | $33,816 |
| Standard Deviation (Population) | $16,912 | $33,356 |
Similar Demographics by Median Family Income
Demographics Similar to Immigrants from Honduras by Median Family Income
In terms of median family income, the demographic groups most similar to Immigrants from Honduras are Immigrants from Mexico ($83,639, a difference of 0.030%), Seminole ($83,354, a difference of 0.32%), Immigrants from Caribbean ($83,319, a difference of 0.36%), Yakama ($83,932, a difference of 0.38%), and Immigrants from Haiti ($84,018, a difference of 0.48%).
| Demographics | Rating | Rank | Median Family Income |
| Cubans | 0.0 /100 | #312 | Tragic $84,981 |
| Choctaw | 0.0 /100 | #313 | Tragic $84,835 |
| Immigrants | Bahamas | 0.0 /100 | #314 | Tragic $84,732 |
| Apache | 0.0 /100 | #315 | Tragic $84,451 |
| Immigrants | Haiti | 0.0 /100 | #316 | Tragic $84,018 |
| Yakama | 0.0 /100 | #317 | Tragic $83,932 |
| Immigrants | Mexico | 0.0 /100 | #318 | Tragic $83,639 |
| Immigrants | Honduras | 0.0 /100 | #319 | Tragic $83,618 |
| Seminole | 0.0 /100 | #320 | Tragic $83,354 |
| Immigrants | Caribbean | 0.0 /100 | #321 | Tragic $83,319 |
| Dominicans | 0.0 /100 | #322 | Tragic $82,888 |
| Bahamians | 0.0 /100 | #323 | Tragic $82,631 |
| Creek | 0.0 /100 | #324 | Tragic $82,560 |
| Sioux | 0.0 /100 | #325 | Tragic $82,386 |
| Immigrants | Congo | 0.0 /100 | #326 | Tragic $82,216 |
Demographics Similar to Moroccans by Median Family Income
In terms of median family income, the demographic groups most similar to Moroccans are Scandinavian ($104,410, a difference of 0.080%), Swiss ($104,396, a difference of 0.090%), Scottish ($104,288, a difference of 0.19%), Icelander ($104,282, a difference of 0.20%), and Basque ($104,760, a difference of 0.26%).
| Demographics | Rating | Rank | Median Family Income |
| Irish | 80.5 /100 | #150 | Excellent $105,453 |
| Peruvians | 80.4 /100 | #151 | Excellent $105,444 |
| Immigrants | Albania | 79.1 /100 | #152 | Good $105,285 |
| Slavs | 77.9 /100 | #153 | Good $105,144 |
| Immigrants | Nepal | 76.3 /100 | #154 | Good $104,966 |
| Native Hawaiians | 75.8 /100 | #155 | Good $104,910 |
| Basques | 74.4 /100 | #156 | Good $104,760 |
| Moroccans | 71.6 /100 | #157 | Good $104,488 |
| Scandinavians | 70.8 /100 | #158 | Good $104,410 |
| Swiss | 70.7 /100 | #159 | Good $104,396 |
| Scottish | 69.5 /100 | #160 | Good $104,288 |
| Icelanders | 69.4 /100 | #161 | Good $104,282 |
| Immigrants | Sierra Leone | 66.2 /100 | #162 | Good $103,990 |
| Costa Ricans | 66.2 /100 | #163 | Good $103,989 |
| Sierra Leoneans | 64.7 /100 | #164 | Good $103,859 |