Immigrants from Honduras vs Houma Median Family Income
COMPARE
Immigrants from Honduras
Houma
Median Family Income
Median Family Income Comparison
Immigrants from Honduras
Houma
$83,618
MEDIAN FAMILY INCOME
0.0/ 100
METRIC RATING
319th/ 347
METRIC RANK
$76,188
MEDIAN FAMILY INCOME
0.0/ 100
METRIC RATING
343rd/ 347
METRIC RANK
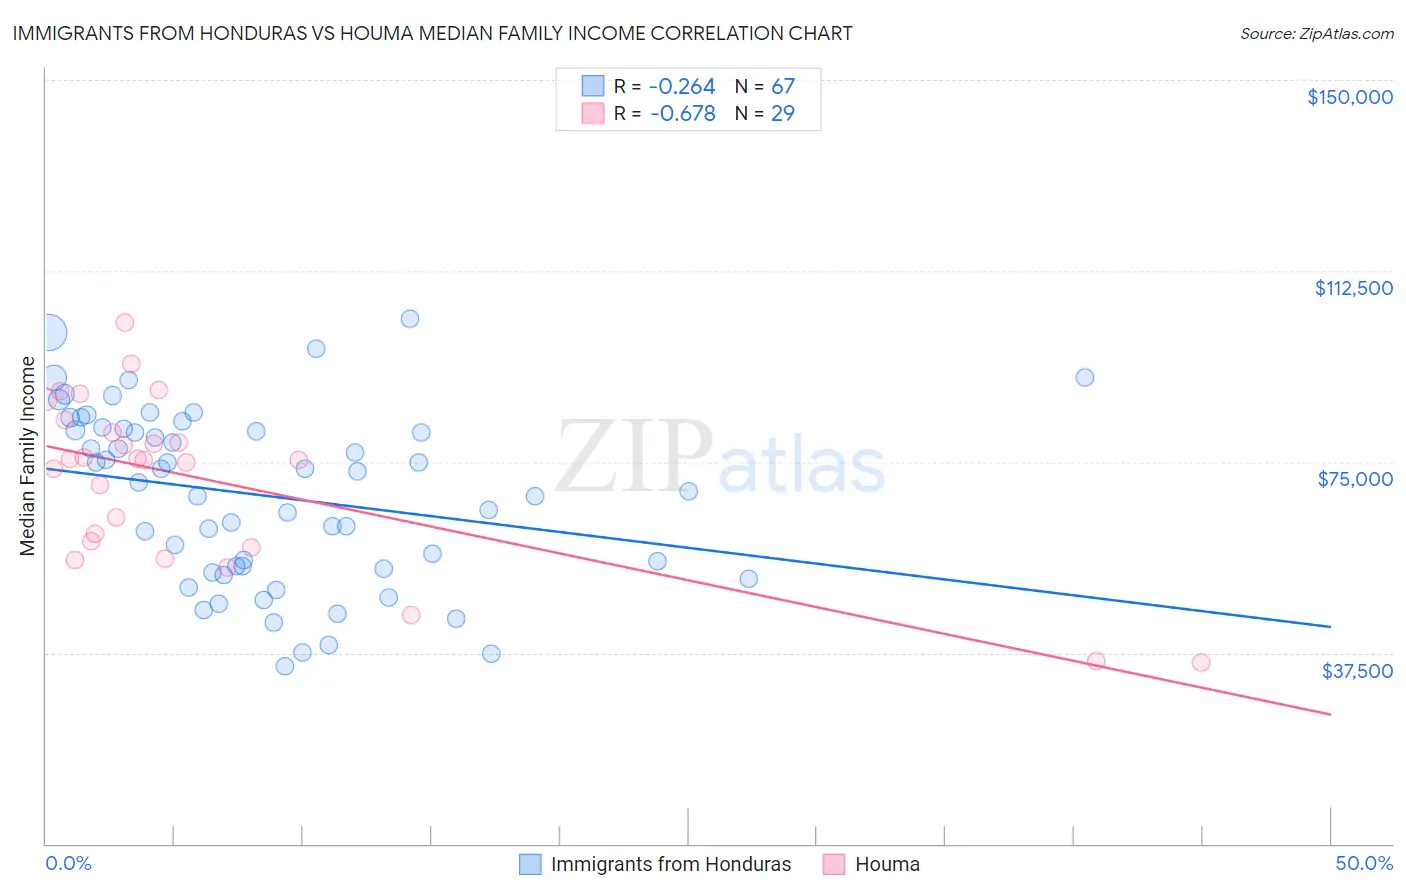
Immigrants from Honduras vs Houma Median Family Income Correlation Chart
The statistical analysis conducted on geographies consisting of 322,401,068 people shows a weak negative correlation between the proportion of Immigrants from Honduras and median family income in the United States with a correlation coefficient (R) of -0.264 and weighted average of $83,618. Similarly, the statistical analysis conducted on geographies consisting of 36,790,797 people shows a significant negative correlation between the proportion of Houma and median family income in the United States with a correlation coefficient (R) of -0.678 and weighted average of $76,188, a difference of 9.8%.
Median Family Income Correlation Summary
| Measurement | Immigrants from Honduras | Houma |
| Minimum | $34,952 | $35,539 |
| Maximum | $103,059 | $102,344 |
| Range | $68,107 | $66,805 |
| Mean | $68,333 | $71,438 |
| Median | $70,983 | $75,379 |
| Interquartile 25% (IQ1) | $53,890 | $58,820 |
| Interquartile 75% (IQ3) | $81,453 | $82,023 |
| Interquartile Range (IQR) | $27,563 | $23,203 |
| Standard Deviation (Sample) | $17,040 | $16,513 |
| Standard Deviation (Population) | $16,912 | $16,226 |
Similar Demographics by Median Family Income
Demographics Similar to Immigrants from Honduras by Median Family Income
In terms of median family income, the demographic groups most similar to Immigrants from Honduras are Immigrants from Mexico ($83,639, a difference of 0.030%), Seminole ($83,354, a difference of 0.32%), Immigrants from Caribbean ($83,319, a difference of 0.36%), Yakama ($83,932, a difference of 0.38%), and Immigrants from Haiti ($84,018, a difference of 0.48%).
| Demographics | Rating | Rank | Median Family Income |
| Cubans | 0.0 /100 | #312 | Tragic $84,981 |
| Choctaw | 0.0 /100 | #313 | Tragic $84,835 |
| Immigrants | Bahamas | 0.0 /100 | #314 | Tragic $84,732 |
| Apache | 0.0 /100 | #315 | Tragic $84,451 |
| Immigrants | Haiti | 0.0 /100 | #316 | Tragic $84,018 |
| Yakama | 0.0 /100 | #317 | Tragic $83,932 |
| Immigrants | Mexico | 0.0 /100 | #318 | Tragic $83,639 |
| Immigrants | Honduras | 0.0 /100 | #319 | Tragic $83,618 |
| Seminole | 0.0 /100 | #320 | Tragic $83,354 |
| Immigrants | Caribbean | 0.0 /100 | #321 | Tragic $83,319 |
| Dominicans | 0.0 /100 | #322 | Tragic $82,888 |
| Bahamians | 0.0 /100 | #323 | Tragic $82,631 |
| Creek | 0.0 /100 | #324 | Tragic $82,560 |
| Sioux | 0.0 /100 | #325 | Tragic $82,386 |
| Immigrants | Congo | 0.0 /100 | #326 | Tragic $82,216 |
Demographics Similar to Houma by Median Family Income
In terms of median family income, the demographic groups most similar to Houma are Crow ($76,605, a difference of 0.55%), Pueblo ($76,880, a difference of 0.91%), Hopi ($77,188, a difference of 1.3%), Pima ($77,431, a difference of 1.6%), and Immigrants from Yemen ($77,457, a difference of 1.7%).
| Demographics | Rating | Rank | Median Family Income |
| Kiowa | 0.0 /100 | #333 | Tragic $80,885 |
| Menominee | 0.0 /100 | #334 | Tragic $79,563 |
| Yup'ik | 0.0 /100 | #335 | Tragic $79,290 |
| Immigrants | Cuba | 0.0 /100 | #336 | Tragic $78,249 |
| Yuman | 0.0 /100 | #337 | Tragic $78,055 |
| Immigrants | Yemen | 0.0 /100 | #338 | Tragic $77,457 |
| Pima | 0.0 /100 | #339 | Tragic $77,431 |
| Hopi | 0.0 /100 | #340 | Tragic $77,188 |
| Pueblo | 0.0 /100 | #341 | Tragic $76,880 |
| Crow | 0.0 /100 | #342 | Tragic $76,605 |
| Houma | 0.0 /100 | #343 | Tragic $76,188 |
| Tohono O'odham | 0.0 /100 | #344 | Tragic $72,193 |
| Navajo | 0.0 /100 | #345 | Tragic $70,989 |
| Puerto Ricans | 0.0 /100 | #346 | Tragic $70,423 |
| Lumbee | 0.0 /100 | #347 | Tragic $68,679 |