Immigrants from Honduras vs Houma Per Capita Income
COMPARE
Immigrants from Honduras
Houma
Per Capita Income
Per Capita Income Comparison
Immigrants from Honduras
Houma
$36,665
PER CAPITA INCOME
0.0/ 100
METRIC RATING
309th/ 347
METRIC RANK
$32,996
PER CAPITA INCOME
0.0/ 100
METRIC RATING
337th/ 347
METRIC RANK
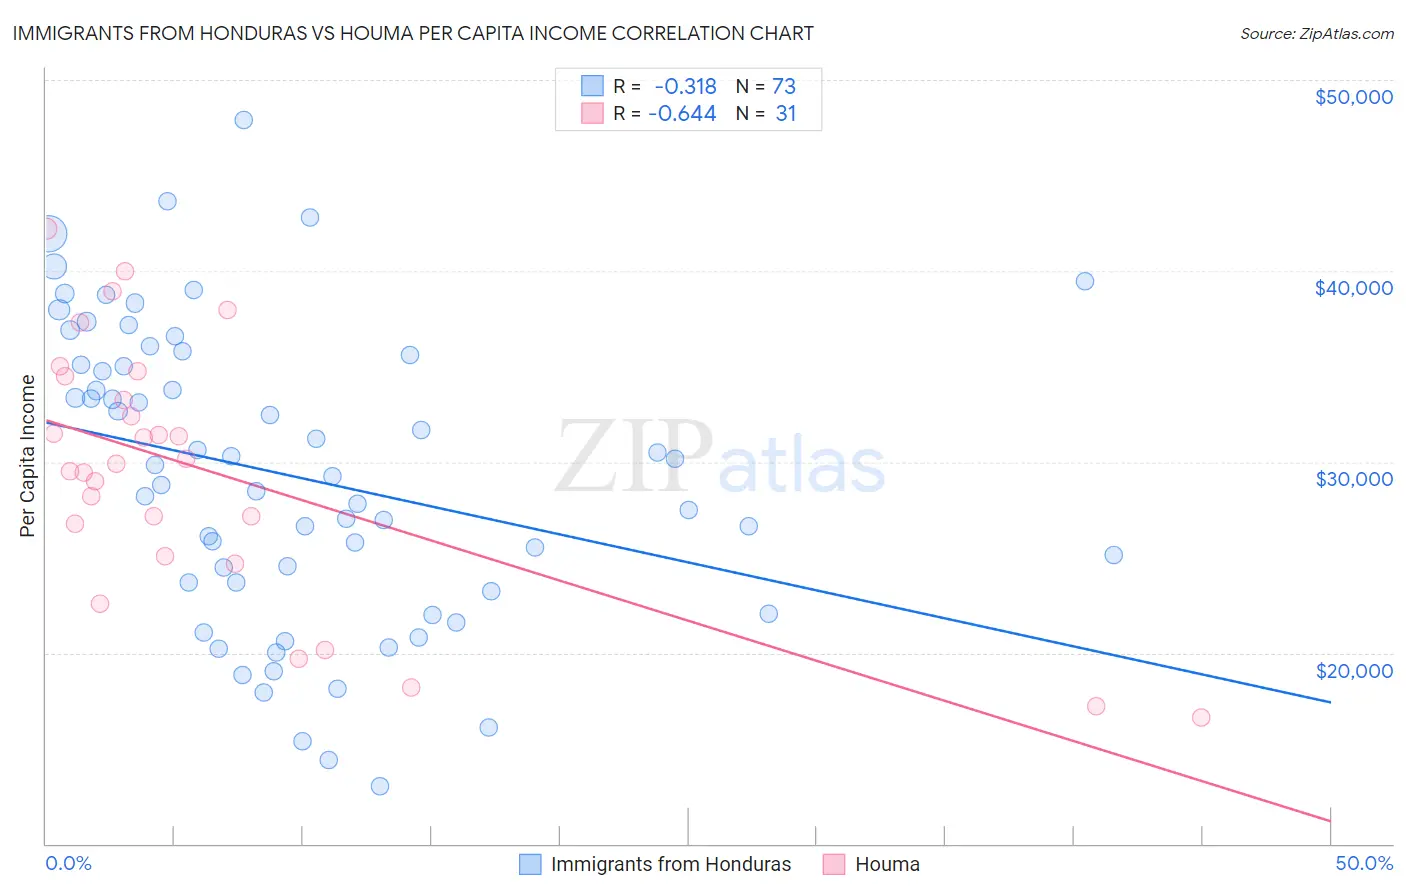
Immigrants from Honduras vs Houma Per Capita Income Correlation Chart
The statistical analysis conducted on geographies consisting of 322,641,994 people shows a mild negative correlation between the proportion of Immigrants from Honduras and per capita income in the United States with a correlation coefficient (R) of -0.318 and weighted average of $36,665. Similarly, the statistical analysis conducted on geographies consisting of 36,799,095 people shows a significant negative correlation between the proportion of Houma and per capita income in the United States with a correlation coefficient (R) of -0.644 and weighted average of $32,996, a difference of 11.1%.
Per Capita Income Correlation Summary
| Measurement | Immigrants from Honduras | Houma |
| Minimum | $13,018 | $16,626 |
| Maximum | $47,908 | $42,187 |
| Range | $34,890 | $25,561 |
| Mean | $29,255 | $29,455 |
| Median | $29,272 | $29,877 |
| Interquartile 25% (IQ1) | $23,483 | $25,090 |
| Interquartile 75% (IQ3) | $35,344 | $34,460 |
| Interquartile Range (IQR) | $11,861 | $9,370 |
| Standard Deviation (Sample) | $7,769 | $6,714 |
| Standard Deviation (Population) | $7,715 | $6,604 |
Similar Demographics by Per Capita Income
Demographics Similar to Immigrants from Honduras by Per Capita Income
In terms of per capita income, the demographic groups most similar to Immigrants from Honduras are Ute ($36,651, a difference of 0.040%), Fijian ($36,690, a difference of 0.070%), Chippewa ($36,631, a difference of 0.090%), Immigrants from Latin America ($36,823, a difference of 0.43%), and Immigrants from Haiti ($36,849, a difference of 0.50%).
| Demographics | Rating | Rank | Per Capita Income |
| Shoshone | 0.1 /100 | #302 | Tragic $37,072 |
| Paiute | 0.1 /100 | #303 | Tragic $37,066 |
| Hondurans | 0.1 /100 | #304 | Tragic $37,031 |
| Inupiat | 0.1 /100 | #305 | Tragic $36,999 |
| Immigrants | Haiti | 0.0 /100 | #306 | Tragic $36,849 |
| Immigrants | Latin America | 0.0 /100 | #307 | Tragic $36,823 |
| Fijians | 0.0 /100 | #308 | Tragic $36,690 |
| Immigrants | Honduras | 0.0 /100 | #309 | Tragic $36,665 |
| Ute | 0.0 /100 | #310 | Tragic $36,651 |
| Chippewa | 0.0 /100 | #311 | Tragic $36,631 |
| Chickasaw | 0.0 /100 | #312 | Tragic $36,475 |
| Bahamians | 0.0 /100 | #313 | Tragic $36,427 |
| Seminole | 0.0 /100 | #314 | Tragic $36,180 |
| Yaqui | 0.0 /100 | #315 | Tragic $36,112 |
| Choctaw | 0.0 /100 | #316 | Tragic $35,999 |
Demographics Similar to Houma by Per Capita Income
In terms of per capita income, the demographic groups most similar to Houma are Yakama ($33,009, a difference of 0.040%), Yuman ($33,236, a difference of 0.73%), Native/Alaskan ($33,279, a difference of 0.86%), Arapaho ($32,345, a difference of 2.0%), and Immigrants from Yemen ($33,696, a difference of 2.1%).
| Demographics | Rating | Rank | Per Capita Income |
| Spanish American Indians | 0.0 /100 | #330 | Tragic $34,195 |
| Immigrants | Mexico | 0.0 /100 | #331 | Tragic $33,931 |
| Sioux | 0.0 /100 | #332 | Tragic $33,921 |
| Immigrants | Yemen | 0.0 /100 | #333 | Tragic $33,696 |
| Natives/Alaskans | 0.0 /100 | #334 | Tragic $33,279 |
| Yuman | 0.0 /100 | #335 | Tragic $33,236 |
| Yakama | 0.0 /100 | #336 | Tragic $33,009 |
| Houma | 0.0 /100 | #337 | Tragic $32,996 |
| Arapaho | 0.0 /100 | #338 | Tragic $32,345 |
| Pueblo | 0.0 /100 | #339 | Tragic $32,012 |
| Crow | 0.0 /100 | #340 | Tragic $31,729 |
| Puerto Ricans | 0.0 /100 | #341 | Tragic $31,268 |
| Hopi | 0.0 /100 | #342 | Tragic $31,177 |
| Pima | 0.0 /100 | #343 | Tragic $30,644 |
| Yup'ik | 0.0 /100 | #344 | Tragic $30,518 |