Immigrants from Honduras vs Cajun Bachelor's Degree
COMPARE
Immigrants from Honduras
Cajun
Bachelor's Degree
Bachelor's Degree Comparison
Immigrants from Honduras
Cajuns
30.9%
BACHELOR'S DEGREE
0.1/ 100
METRIC RATING
290th/ 347
METRIC RANK
29.6%
BACHELOR'S DEGREE
0.0/ 100
METRIC RATING
308th/ 347
METRIC RANK
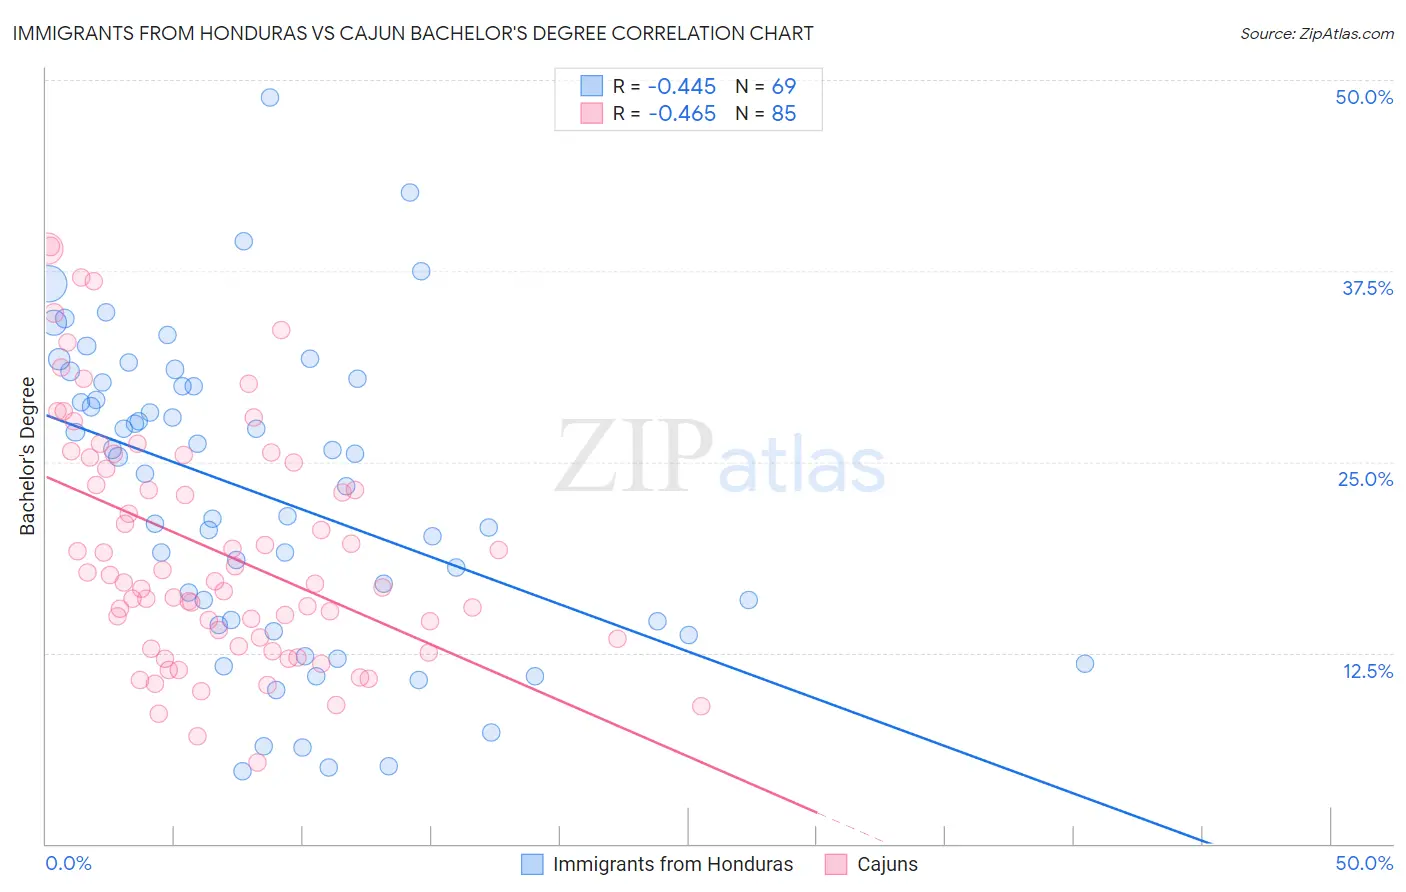
Immigrants from Honduras vs Cajun Bachelor's Degree Correlation Chart
The statistical analysis conducted on geographies consisting of 322,614,162 people shows a moderate negative correlation between the proportion of Immigrants from Honduras and percentage of population with at least bachelor's degree education in the United States with a correlation coefficient (R) of -0.445 and weighted average of 30.9%. Similarly, the statistical analysis conducted on geographies consisting of 149,707,155 people shows a moderate negative correlation between the proportion of Cajuns and percentage of population with at least bachelor's degree education in the United States with a correlation coefficient (R) of -0.465 and weighted average of 29.6%, a difference of 4.4%.
Bachelor's Degree Correlation Summary
| Measurement | Immigrants from Honduras | Cajun |
| Minimum | 4.8% | 5.4% |
| Maximum | 48.9% | 39.1% |
| Range | 44.1% | 33.8% |
| Mean | 22.7% | 19.2% |
| Median | 24.2% | 17.1% |
| Interquartile 25% (IQ1) | 14.4% | 13.2% |
| Interquartile 75% (IQ3) | 30.1% | 25.1% |
| Interquartile Range (IQR) | 15.7% | 11.9% |
| Standard Deviation (Sample) | 9.9% | 7.8% |
| Standard Deviation (Population) | 9.8% | 7.8% |
Demographics Similar to Immigrants from Honduras and Cajuns by Bachelor's Degree
In terms of bachelor's degree, the demographic groups most similar to Immigrants from Honduras are Puerto Rican (31.0%, a difference of 0.040%), Black/African American (30.9%, a difference of 0.040%), Ute (30.9%, a difference of 0.12%), Cape Verdean (30.9%, a difference of 0.21%), and Immigrants from Guatemala (30.8%, a difference of 0.61%). Similarly, the demographic groups most similar to Cajuns are Hispanic or Latino (29.6%, a difference of 0.18%), Nepalese (29.9%, a difference of 0.86%), Immigrants from Yemen (29.9%, a difference of 0.89%), Immigrants from Latin America (30.1%, a difference of 1.4%), and Cherokee (30.2%, a difference of 1.9%).
| Demographics | Rating | Rank | Bachelor's Degree |
| Puerto Ricans | 0.1 /100 | #289 | Tragic 31.0% |
| Immigrants | Honduras | 0.1 /100 | #290 | Tragic 30.9% |
| Blacks/African Americans | 0.1 /100 | #291 | Tragic 30.9% |
| Ute | 0.1 /100 | #292 | Tragic 30.9% |
| Cape Verdeans | 0.1 /100 | #293 | Tragic 30.9% |
| Immigrants | Guatemala | 0.0 /100 | #294 | Tragic 30.8% |
| Immigrants | Dominican Republic | 0.0 /100 | #295 | Tragic 30.7% |
| Puget Sound Salish | 0.0 /100 | #296 | Tragic 30.7% |
| Immigrants | Haiti | 0.0 /100 | #297 | Tragic 30.6% |
| Chippewa | 0.0 /100 | #298 | Tragic 30.6% |
| Chickasaw | 0.0 /100 | #299 | Tragic 30.4% |
| Immigrants | Micronesia | 0.0 /100 | #300 | Tragic 30.4% |
| Immigrants | Cuba | 0.0 /100 | #301 | Tragic 30.3% |
| Mexican American Indians | 0.0 /100 | #302 | Tragic 30.2% |
| Bangladeshis | 0.0 /100 | #303 | Tragic 30.2% |
| Cherokee | 0.0 /100 | #304 | Tragic 30.2% |
| Immigrants | Latin America | 0.0 /100 | #305 | Tragic 30.1% |
| Immigrants | Yemen | 0.0 /100 | #306 | Tragic 29.9% |
| Nepalese | 0.0 /100 | #307 | Tragic 29.9% |
| Cajuns | 0.0 /100 | #308 | Tragic 29.6% |
| Hispanics or Latinos | 0.0 /100 | #309 | Tragic 29.6% |