Immigrants from Jamaica vs Ecuadorian Median Earnings
COMPARE
Immigrants from Jamaica
Ecuadorian
Median Earnings
Median Earnings Comparison
Immigrants from Jamaica
Ecuadorians
$43,026
MEDIAN EARNINGS
0.8/ 100
METRIC RATING
261st/ 347
METRIC RANK
$45,214
MEDIAN EARNINGS
15.3/ 100
METRIC RATING
220th/ 347
METRIC RANK
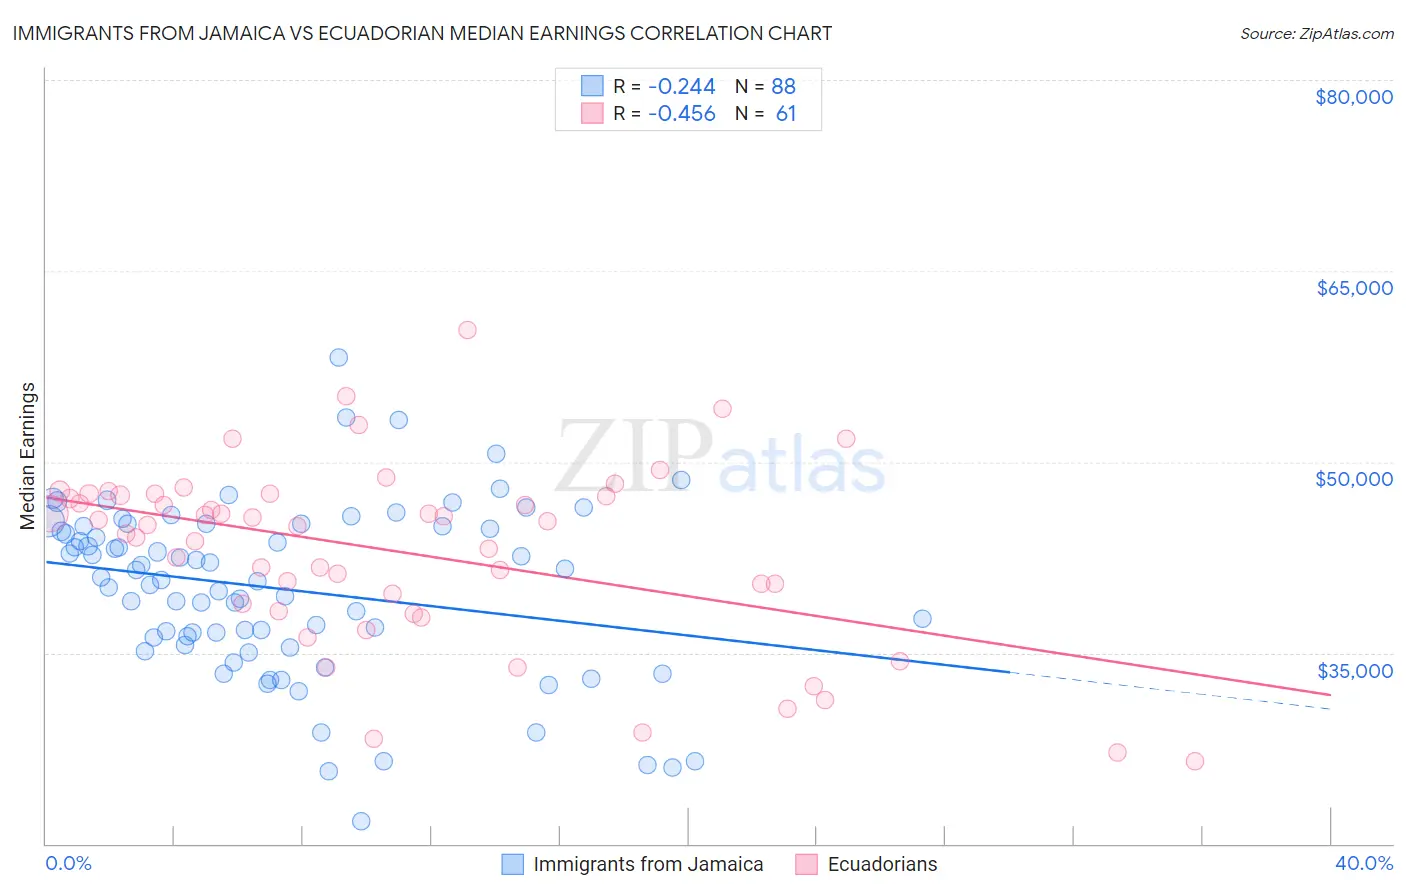
Immigrants from Jamaica vs Ecuadorian Median Earnings Correlation Chart
The statistical analysis conducted on geographies consisting of 301,808,266 people shows a weak negative correlation between the proportion of Immigrants from Jamaica and median earnings in the United States with a correlation coefficient (R) of -0.244 and weighted average of $43,026. Similarly, the statistical analysis conducted on geographies consisting of 317,848,977 people shows a moderate negative correlation between the proportion of Ecuadorians and median earnings in the United States with a correlation coefficient (R) of -0.456 and weighted average of $45,214, a difference of 5.1%.
Median Earnings Correlation Summary
| Measurement | Immigrants from Jamaica | Ecuadorian |
| Minimum | $21,741 | $26,500 |
| Maximum | $58,155 | $60,377 |
| Range | $36,414 | $33,877 |
| Mean | $40,000 | $42,954 |
| Median | $40,853 | $45,047 |
| Interquartile 25% (IQ1) | $35,870 | $38,574 |
| Interquartile 75% (IQ3) | $44,978 | $47,434 |
| Interquartile Range (IQR) | $9,108 | $8,860 |
| Standard Deviation (Sample) | $6,782 | $7,114 |
| Standard Deviation (Population) | $6,743 | $7,055 |
Similar Demographics by Median Earnings
Demographics Similar to Immigrants from Jamaica by Median Earnings
In terms of median earnings, the demographic groups most similar to Immigrants from Jamaica are Nicaraguan ($43,026, a difference of 0.0%), Inupiat ($43,000, a difference of 0.060%), Immigrants from Somalia ($43,100, a difference of 0.17%), Immigrants from Liberia ($42,923, a difference of 0.24%), and Salvadoran ($42,912, a difference of 0.27%).
| Demographics | Rating | Rank | Median Earnings |
| Liberians | 1.7 /100 | #254 | Tragic $43,536 |
| Immigrants | Middle Africa | 1.4 /100 | #255 | Tragic $43,416 |
| Alaskan Athabascans | 1.4 /100 | #256 | Tragic $43,393 |
| Jamaicans | 1.3 /100 | #257 | Tragic $43,343 |
| French American Indians | 1.3 /100 | #258 | Tragic $43,333 |
| German Russians | 1.1 /100 | #259 | Tragic $43,200 |
| Immigrants | Somalia | 0.9 /100 | #260 | Tragic $43,100 |
| Immigrants | Jamaica | 0.8 /100 | #261 | Tragic $43,026 |
| Nicaraguans | 0.8 /100 | #262 | Tragic $43,026 |
| Inupiat | 0.8 /100 | #263 | Tragic $43,000 |
| Immigrants | Liberia | 0.7 /100 | #264 | Tragic $42,923 |
| Salvadorans | 0.7 /100 | #265 | Tragic $42,912 |
| Immigrants | Laos | 0.7 /100 | #266 | Tragic $42,884 |
| Cree | 0.6 /100 | #267 | Tragic $42,777 |
| Americans | 0.6 /100 | #268 | Tragic $42,742 |
Demographics Similar to Ecuadorians by Median Earnings
In terms of median earnings, the demographic groups most similar to Ecuadorians are Immigrants from Guyana ($45,204, a difference of 0.020%), Immigrants from Panama ($45,198, a difference of 0.030%), White/Caucasian ($45,197, a difference of 0.040%), West Indian ($45,132, a difference of 0.18%), and Immigrants from Cambodia ($45,090, a difference of 0.28%).
| Demographics | Rating | Rank | Median Earnings |
| Immigrants | Colombia | 22.4 /100 | #213 | Fair $45,550 |
| Nigerians | 22.0 /100 | #214 | Fair $45,532 |
| Immigrants | Bangladesh | 22.0 /100 | #215 | Fair $45,532 |
| Guyanese | 20.6 /100 | #216 | Fair $45,470 |
| Tlingit-Haida | 20.5 /100 | #217 | Fair $45,468 |
| Spanish | 19.7 /100 | #218 | Poor $45,432 |
| Dutch | 18.4 /100 | #219 | Poor $45,370 |
| Ecuadorians | 15.3 /100 | #220 | Poor $45,214 |
| Immigrants | Guyana | 15.1 /100 | #221 | Poor $45,204 |
| Immigrants | Panama | 15.0 /100 | #222 | Poor $45,198 |
| Whites/Caucasians | 15.0 /100 | #223 | Poor $45,197 |
| West Indians | 13.9 /100 | #224 | Poor $45,132 |
| Immigrants | Cambodia | 13.2 /100 | #225 | Poor $45,090 |
| Immigrants | Nigeria | 12.2 /100 | #226 | Poor $45,030 |
| Native Hawaiians | 12.2 /100 | #227 | Poor $45,027 |