Immigrants from Grenada vs Hungarian Median Male Earnings
COMPARE
Immigrants from Grenada
Hungarian
Median Male Earnings
Median Male Earnings Comparison
Immigrants from Grenada
Hungarians
$50,279
MEDIAN MALE EARNINGS
1.6/ 100
METRIC RATING
251st/ 347
METRIC RANK
$57,309
MEDIAN MALE EARNINGS
94.0/ 100
METRIC RATING
118th/ 347
METRIC RANK
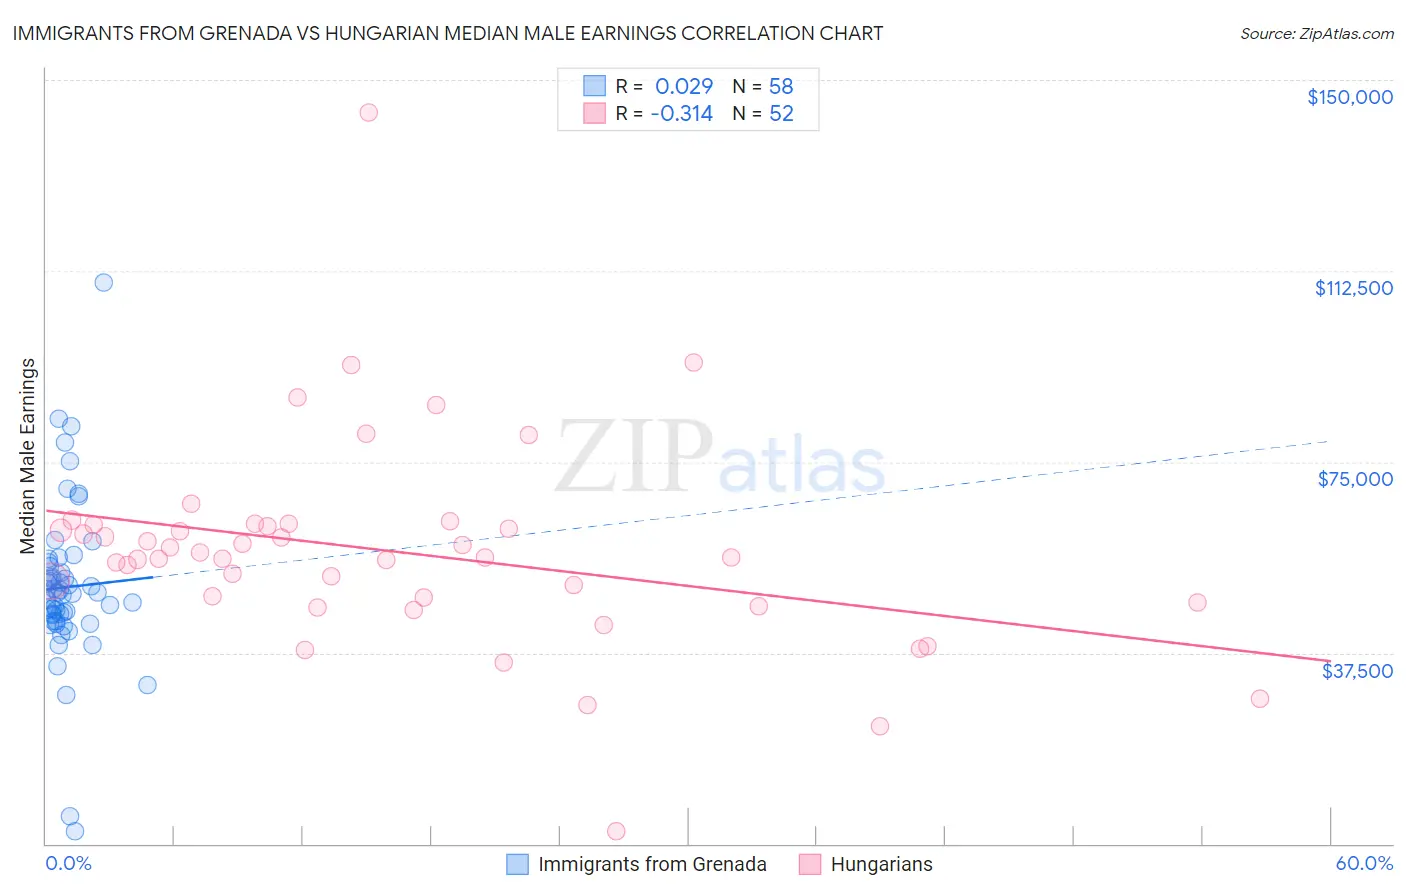
Immigrants from Grenada vs Hungarian Median Male Earnings Correlation Chart
The statistical analysis conducted on geographies consisting of 67,198,306 people shows no correlation between the proportion of Immigrants from Grenada and median male earnings in the United States with a correlation coefficient (R) of 0.029 and weighted average of $50,279. Similarly, the statistical analysis conducted on geographies consisting of 485,879,965 people shows a mild negative correlation between the proportion of Hungarians and median male earnings in the United States with a correlation coefficient (R) of -0.314 and weighted average of $57,309, a difference of 14.0%.
Median Male Earnings Correlation Summary
| Measurement | Immigrants from Grenada | Hungarian |
| Minimum | $2,499 | $2,499 |
| Maximum | $110,313 | $143,630 |
| Range | $107,814 | $141,131 |
| Mean | $50,381 | $57,349 |
| Median | $49,246 | $56,238 |
| Interquartile 25% (IQ1) | $43,797 | $47,969 |
| Interquartile 75% (IQ3) | $54,582 | $62,536 |
| Interquartile Range (IQR) | $10,785 | $14,567 |
| Standard Deviation (Sample) | $16,114 | $20,677 |
| Standard Deviation (Population) | $15,975 | $20,477 |
Similar Demographics by Median Male Earnings
Demographics Similar to Immigrants from Grenada by Median Male Earnings
In terms of median male earnings, the demographic groups most similar to Immigrants from Grenada are Osage ($50,292, a difference of 0.020%), Immigrants from Burma/Myanmar ($50,298, a difference of 0.040%), Immigrants from Guyana ($50,321, a difference of 0.080%), Subsaharan African ($50,408, a difference of 0.26%), and Immigrants from Ecuador ($50,474, a difference of 0.39%).
| Demographics | Rating | Rank | Median Male Earnings |
| Houma | 2.0 /100 | #244 | Tragic $50,547 |
| Hawaiians | 1.9 /100 | #245 | Tragic $50,488 |
| Immigrants | Ecuador | 1.9 /100 | #246 | Tragic $50,474 |
| Sub-Saharan Africans | 1.8 /100 | #247 | Tragic $50,408 |
| Immigrants | Guyana | 1.6 /100 | #248 | Tragic $50,321 |
| Immigrants | Burma/Myanmar | 1.6 /100 | #249 | Tragic $50,298 |
| Osage | 1.6 /100 | #250 | Tragic $50,292 |
| Immigrants | Grenada | 1.6 /100 | #251 | Tragic $50,279 |
| Immigrants | Cabo Verde | 1.2 /100 | #252 | Tragic $50,009 |
| German Russians | 1.1 /100 | #253 | Tragic $49,924 |
| Senegalese | 1.0 /100 | #254 | Tragic $49,774 |
| Alaskan Athabascans | 0.9 /100 | #255 | Tragic $49,748 |
| Alaska Natives | 0.9 /100 | #256 | Tragic $49,711 |
| British West Indians | 0.8 /100 | #257 | Tragic $49,636 |
| Cree | 0.7 /100 | #258 | Tragic $49,497 |
Demographics Similar to Hungarians by Median Male Earnings
In terms of median male earnings, the demographic groups most similar to Hungarians are Arab ($57,298, a difference of 0.020%), Canadian ($57,286, a difference of 0.040%), Immigrants from Zimbabwe ($57,352, a difference of 0.080%), Lebanese ($57,409, a difference of 0.18%), and Immigrants from Albania ($57,179, a difference of 0.23%).
| Demographics | Rating | Rank | Median Male Earnings |
| Europeans | 95.6 /100 | #111 | Exceptional $57,637 |
| Immigrants | Afghanistan | 95.4 /100 | #112 | Exceptional $57,582 |
| Carpatho Rusyns | 95.3 /100 | #113 | Exceptional $57,572 |
| Immigrants | Kuwait | 95.3 /100 | #114 | Exceptional $57,562 |
| Swedes | 94.8 /100 | #115 | Exceptional $57,445 |
| Lebanese | 94.6 /100 | #116 | Exceptional $57,409 |
| Immigrants | Zimbabwe | 94.3 /100 | #117 | Exceptional $57,352 |
| Hungarians | 94.0 /100 | #118 | Exceptional $57,309 |
| Arabs | 94.0 /100 | #119 | Exceptional $57,298 |
| Canadians | 93.9 /100 | #120 | Exceptional $57,286 |
| Immigrants | Albania | 93.3 /100 | #121 | Exceptional $57,179 |
| Immigrants | Jordan | 93.1 /100 | #122 | Exceptional $57,145 |
| Slovenes | 93.1 /100 | #123 | Exceptional $57,145 |
| Chileans | 91.9 /100 | #124 | Exceptional $56,973 |
| Immigrants | Morocco | 91.8 /100 | #125 | Exceptional $56,958 |