Immigrants from Germany vs New Zealander Householder Income Over 65 years
COMPARE
Immigrants from Germany
New Zealander
Householder Income Over 65 years
Householder Income Over 65 years Comparison
Immigrants from Germany
New Zealanders
$62,544
HOUSEHOLDER INCOME OVER 65 YEARS
83.9/ 100
METRIC RATING
132nd/ 347
METRIC RANK
$67,333
HOUSEHOLDER INCOME OVER 65 YEARS
99.9/ 100
METRIC RATING
42nd/ 347
METRIC RANK
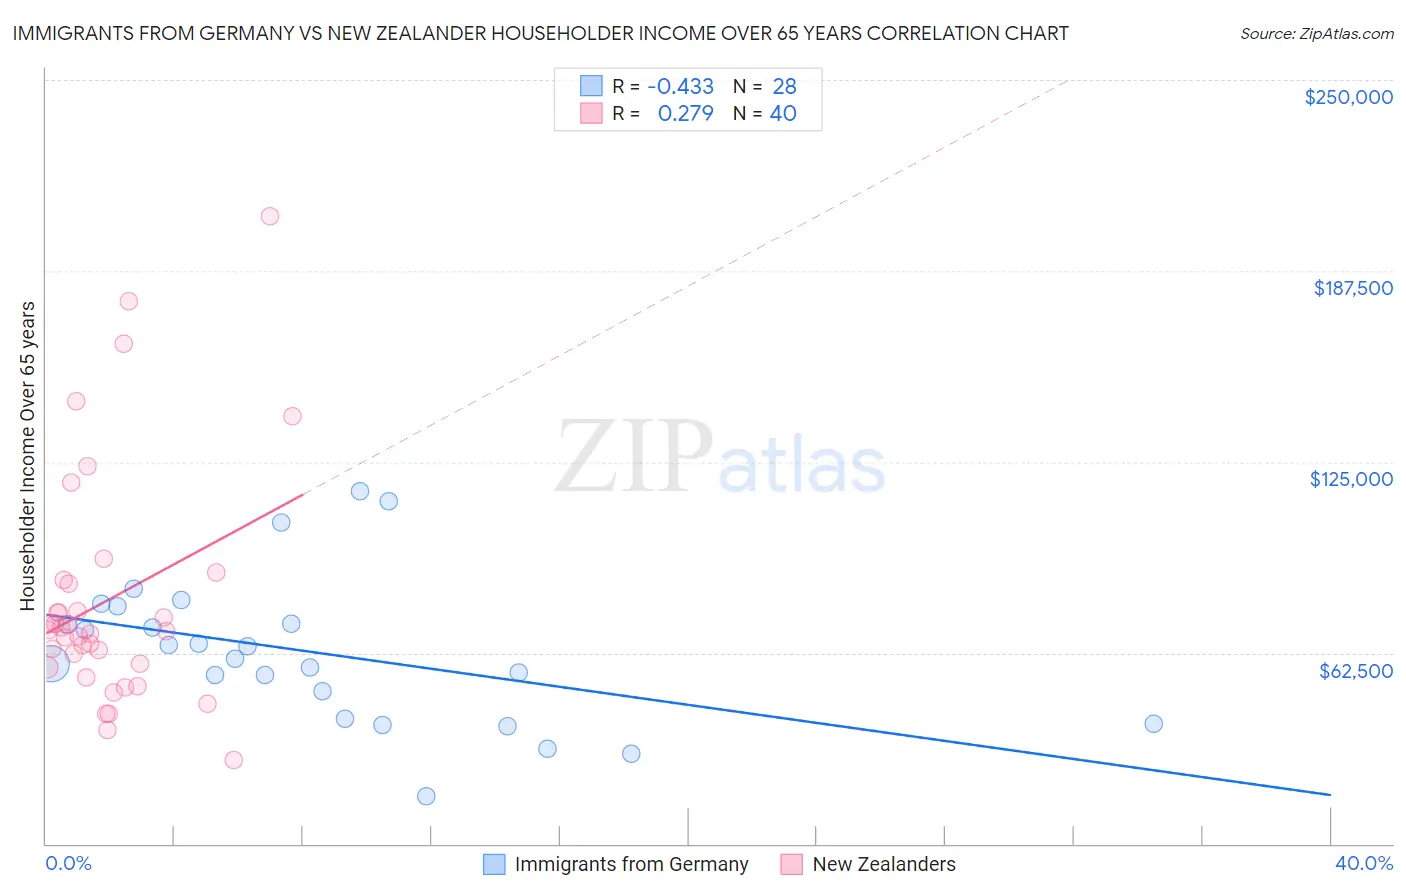
Immigrants from Germany vs New Zealander Householder Income Over 65 years Correlation Chart
The statistical analysis conducted on geographies consisting of 462,250,786 people shows a moderate negative correlation between the proportion of Immigrants from Germany and household income with householder over the age of 65 in the United States with a correlation coefficient (R) of -0.433 and weighted average of $62,544. Similarly, the statistical analysis conducted on geographies consisting of 106,796,151 people shows a weak positive correlation between the proportion of New Zealanders and household income with householder over the age of 65 in the United States with a correlation coefficient (R) of 0.279 and weighted average of $67,333, a difference of 7.7%.
Householder Income Over 65 years Correlation Summary
| Measurement | Immigrants from Germany | New Zealander |
| Minimum | $15,625 | $27,419 |
| Maximum | $115,357 | $205,469 |
| Range | $99,732 | $178,050 |
| Mean | $62,831 | $79,932 |
| Median | $62,572 | $69,710 |
| Interquartile 25% (IQ1) | $45,444 | $58,322 |
| Interquartile 75% (IQ3) | $74,989 | $85,553 |
| Interquartile Range (IQR) | $29,545 | $27,231 |
| Standard Deviation (Sample) | $23,868 | $38,798 |
| Standard Deviation (Population) | $23,438 | $38,310 |
Similar Demographics by Householder Income Over 65 years
Demographics Similar to Immigrants from Germany by Householder Income Over 65 years
In terms of householder income over 65 years, the demographic groups most similar to Immigrants from Germany are Immigrants from Northern Africa ($62,522, a difference of 0.040%), Immigrants from Western Asia ($62,645, a difference of 0.16%), Basque ($62,653, a difference of 0.17%), Immigrants from Eastern Europe ($62,693, a difference of 0.24%), and Aleut ($62,708, a difference of 0.26%).
| Demographics | Rating | Rank | Householder Income Over 65 years |
| Soviet Union | 87.8 /100 | #125 | Excellent $62,848 |
| Peruvians | 86.8 /100 | #126 | Excellent $62,766 |
| Swedes | 86.4 /100 | #127 | Excellent $62,736 |
| Aleuts | 86.1 /100 | #128 | Excellent $62,708 |
| Immigrants | Eastern Europe | 85.9 /100 | #129 | Excellent $62,693 |
| Basques | 85.4 /100 | #130 | Excellent $62,653 |
| Immigrants | Western Asia | 85.3 /100 | #131 | Excellent $62,645 |
| Immigrants | Germany | 83.9 /100 | #132 | Excellent $62,544 |
| Immigrants | Northern Africa | 83.6 /100 | #133 | Excellent $62,522 |
| Immigrants | Brazil | 81.2 /100 | #134 | Excellent $62,364 |
| Immigrants | Chile | 81.0 /100 | #135 | Excellent $62,354 |
| Alaskan Athabascans | 80.6 /100 | #136 | Excellent $62,330 |
| Immigrants | Syria | 80.2 /100 | #137 | Excellent $62,303 |
| Immigrants | Kazakhstan | 80.0 /100 | #138 | Excellent $62,292 |
| Lebanese | 79.9 /100 | #139 | Good $62,287 |
Demographics Similar to New Zealanders by Householder Income Over 65 years
In terms of householder income over 65 years, the demographic groups most similar to New Zealanders are Latvian ($67,326, a difference of 0.010%), Immigrants from South Africa ($67,234, a difference of 0.15%), Korean ($67,472, a difference of 0.21%), Immigrants from Asia ($67,594, a difference of 0.39%), and Russian ($67,626, a difference of 0.44%).
| Demographics | Rating | Rank | Householder Income Over 65 years |
| Tongans | 100.0 /100 | #35 | Exceptional $68,235 |
| Immigrants | Austria | 99.9 /100 | #36 | Exceptional $68,208 |
| Turks | 99.9 /100 | #37 | Exceptional $68,037 |
| Estonians | 99.9 /100 | #38 | Exceptional $67,926 |
| Russians | 99.9 /100 | #39 | Exceptional $67,626 |
| Immigrants | Asia | 99.9 /100 | #40 | Exceptional $67,594 |
| Koreans | 99.9 /100 | #41 | Exceptional $67,472 |
| New Zealanders | 99.9 /100 | #42 | Exceptional $67,333 |
| Latvians | 99.9 /100 | #43 | Exceptional $67,326 |
| Immigrants | South Africa | 99.9 /100 | #44 | Exceptional $67,234 |
| Immigrants | Afghanistan | 99.8 /100 | #45 | Exceptional $67,007 |
| Cambodians | 99.8 /100 | #46 | Exceptional $66,892 |
| Australians | 99.8 /100 | #47 | Exceptional $66,891 |
| Immigrants | France | 99.8 /100 | #48 | Exceptional $66,826 |
| Immigrants | Indonesia | 99.8 /100 | #49 | Exceptional $66,694 |