Immigrants from Germany vs French American Indian Unemployment Among Women with Children Under 6 years
COMPARE
Immigrants from Germany
French American Indian
Unemployment Among Women with Children Under 6 years
Unemployment Among Women with Children Under 6 years Comparison
Immigrants from Germany
French American Indians
7.9%
UNEMPLOYMENT AMONG WOMEN WITH CHILDREN UNDER 6 YEARS
8.5/ 100
METRIC RATING
221st/ 347
METRIC RANK
9.2%
UNEMPLOYMENT AMONG WOMEN WITH CHILDREN UNDER 6 YEARS
0.0/ 100
METRIC RATING
311th/ 347
METRIC RANK
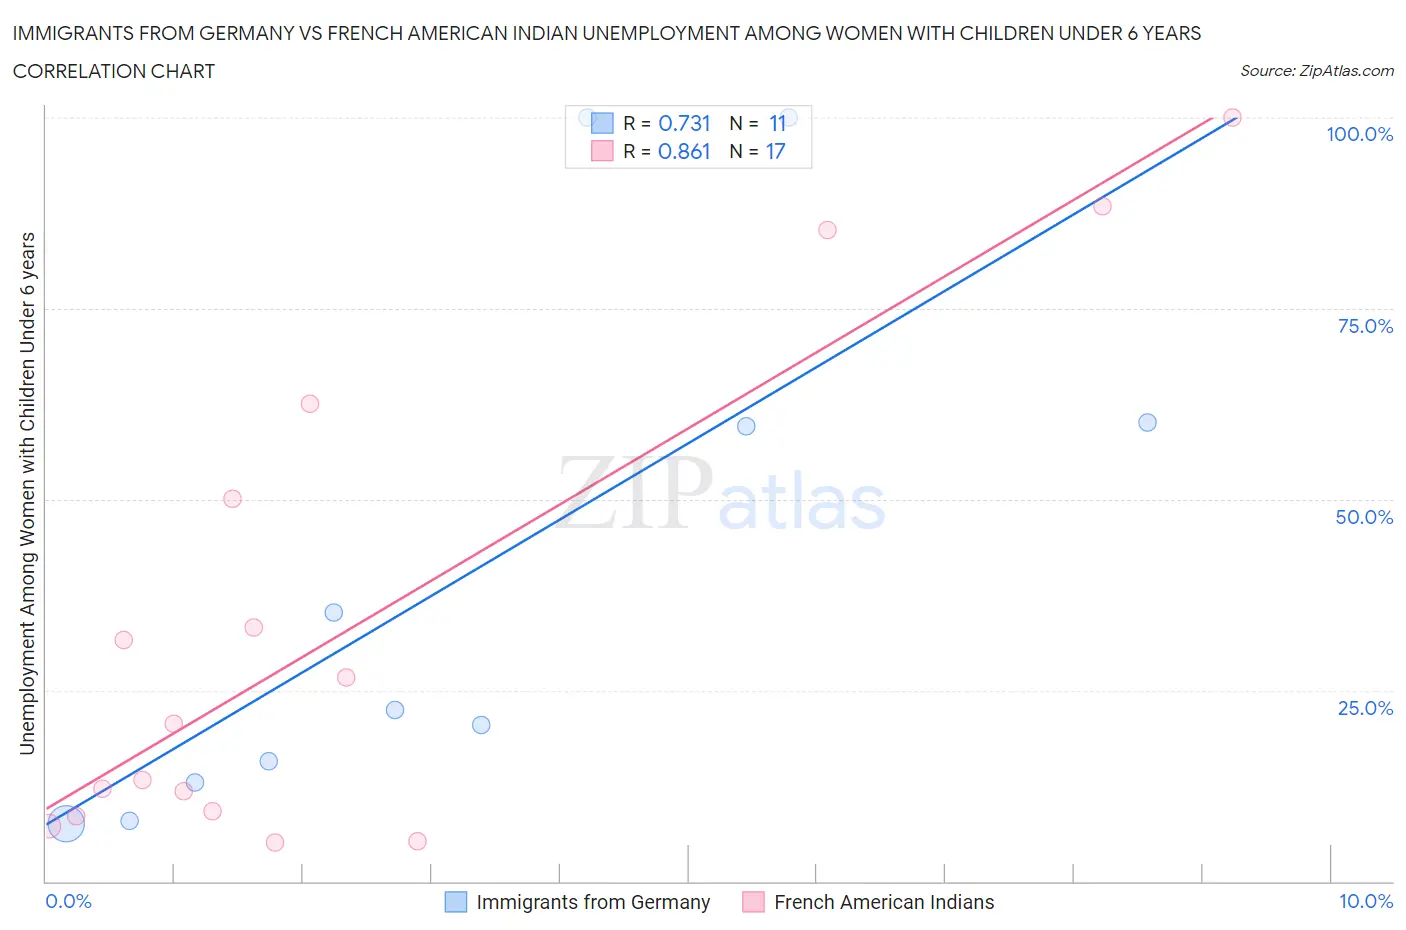
Immigrants from Germany vs French American Indian Unemployment Among Women with Children Under 6 years Correlation Chart
The statistical analysis conducted on geographies consisting of 335,343,669 people shows a strong positive correlation between the proportion of Immigrants from Germany and unemployment rate among women with children under the age of 6 in the United States with a correlation coefficient (R) of 0.731 and weighted average of 7.9%. Similarly, the statistical analysis conducted on geographies consisting of 112,876,255 people shows a very strong positive correlation between the proportion of French American Indians and unemployment rate among women with children under the age of 6 in the United States with a correlation coefficient (R) of 0.861 and weighted average of 9.2%, a difference of 15.8%.
Unemployment Among Women with Children Under 6 years Correlation Summary
| Measurement | Immigrants from Germany | French American Indian |
| Minimum | 7.6% | 5.0% |
| Maximum | 100.0% | 100.0% |
| Range | 92.4% | 95.0% |
| Mean | 40.2% | 33.6% |
| Median | 22.4% | 20.5% |
| Interquartile 25% (IQ1) | 12.9% | 8.8% |
| Interquartile 75% (IQ3) | 60.0% | 56.3% |
| Interquartile Range (IQR) | 47.1% | 47.5% |
| Standard Deviation (Sample) | 34.8% | 31.9% |
| Standard Deviation (Population) | 33.2% | 31.0% |
Similar Demographics by Unemployment Among Women with Children Under 6 years
Demographics Similar to Immigrants from Germany by Unemployment Among Women with Children Under 6 years
In terms of unemployment among women with children under 6 years, the demographic groups most similar to Immigrants from Germany are Samoan (7.9%, a difference of 0.020%), Carpatho Rusyn (8.0%, a difference of 0.15%), South American Indian (7.9%, a difference of 0.16%), Arab (7.9%, a difference of 0.17%), and Moroccan (7.9%, a difference of 0.25%).
| Demographics | Rating | Rank | Unemployment Among Women with Children Under 6 years |
| Spanish | 11.3 /100 | #214 | Poor 7.9% |
| Ecuadorians | 11.2 /100 | #215 | Poor 7.9% |
| Immigrants | Lebanon | 11.1 /100 | #216 | Poor 7.9% |
| Immigrants | Nigeria | 10.3 /100 | #217 | Poor 7.9% |
| Moroccans | 9.7 /100 | #218 | Tragic 7.9% |
| Arabs | 9.4 /100 | #219 | Tragic 7.9% |
| South American Indians | 9.3 /100 | #220 | Tragic 7.9% |
| Immigrants | Germany | 8.5 /100 | #221 | Tragic 7.9% |
| Samoans | 8.4 /100 | #222 | Tragic 7.9% |
| Carpatho Rusyns | 7.8 /100 | #223 | Tragic 8.0% |
| English | 7.2 /100 | #224 | Tragic 8.0% |
| Germans | 7.0 /100 | #225 | Tragic 8.0% |
| Senegalese | 6.2 /100 | #226 | Tragic 8.0% |
| Portuguese | 6.2 /100 | #227 | Tragic 8.0% |
| Immigrants | Sudan | 6.0 /100 | #228 | Tragic 8.0% |
Demographics Similar to French American Indians by Unemployment Among Women with Children Under 6 years
In terms of unemployment among women with children under 6 years, the demographic groups most similar to French American Indians are Immigrants from the Azores (9.2%, a difference of 0.14%), Cajun (9.2%, a difference of 0.28%), African (9.2%, a difference of 0.41%), American (9.3%, a difference of 0.58%), and Fijian (9.3%, a difference of 0.61%).
| Demographics | Rating | Rank | Unemployment Among Women with Children Under 6 years |
| Immigrants | Mexico | 0.0 /100 | #304 | Tragic 9.1% |
| Alaskan Athabascans | 0.0 /100 | #305 | Tragic 9.1% |
| Pueblo | 0.0 /100 | #306 | Tragic 9.1% |
| Dominicans | 0.0 /100 | #307 | Tragic 9.1% |
| Immigrants | Micronesia | 0.0 /100 | #308 | Tragic 9.1% |
| Africans | 0.0 /100 | #309 | Tragic 9.2% |
| Cajuns | 0.0 /100 | #310 | Tragic 9.2% |
| French American Indians | 0.0 /100 | #311 | Tragic 9.2% |
| Immigrants | Azores | 0.0 /100 | #312 | Tragic 9.2% |
| Americans | 0.0 /100 | #313 | Tragic 9.3% |
| Fijians | 0.0 /100 | #314 | Tragic 9.3% |
| Cherokee | 0.0 /100 | #315 | Tragic 9.3% |
| Houma | 0.0 /100 | #316 | Tragic 9.4% |
| Dutch West Indians | 0.0 /100 | #317 | Tragic 9.5% |
| Osage | 0.0 /100 | #318 | Tragic 9.5% |