Immigrants from Fiji vs Immigrants from Central America Median Female Earnings
COMPARE
Immigrants from Fiji
Immigrants from Central America
Median Female Earnings
Median Female Earnings Comparison
Immigrants from Fiji
Immigrants from Central America
$41,656
MEDIAN FEMALE EARNINGS
98.3/ 100
METRIC RATING
101st/ 347
METRIC RANK
$33,953
MEDIAN FEMALE EARNINGS
0.0/ 100
METRIC RATING
328th/ 347
METRIC RANK
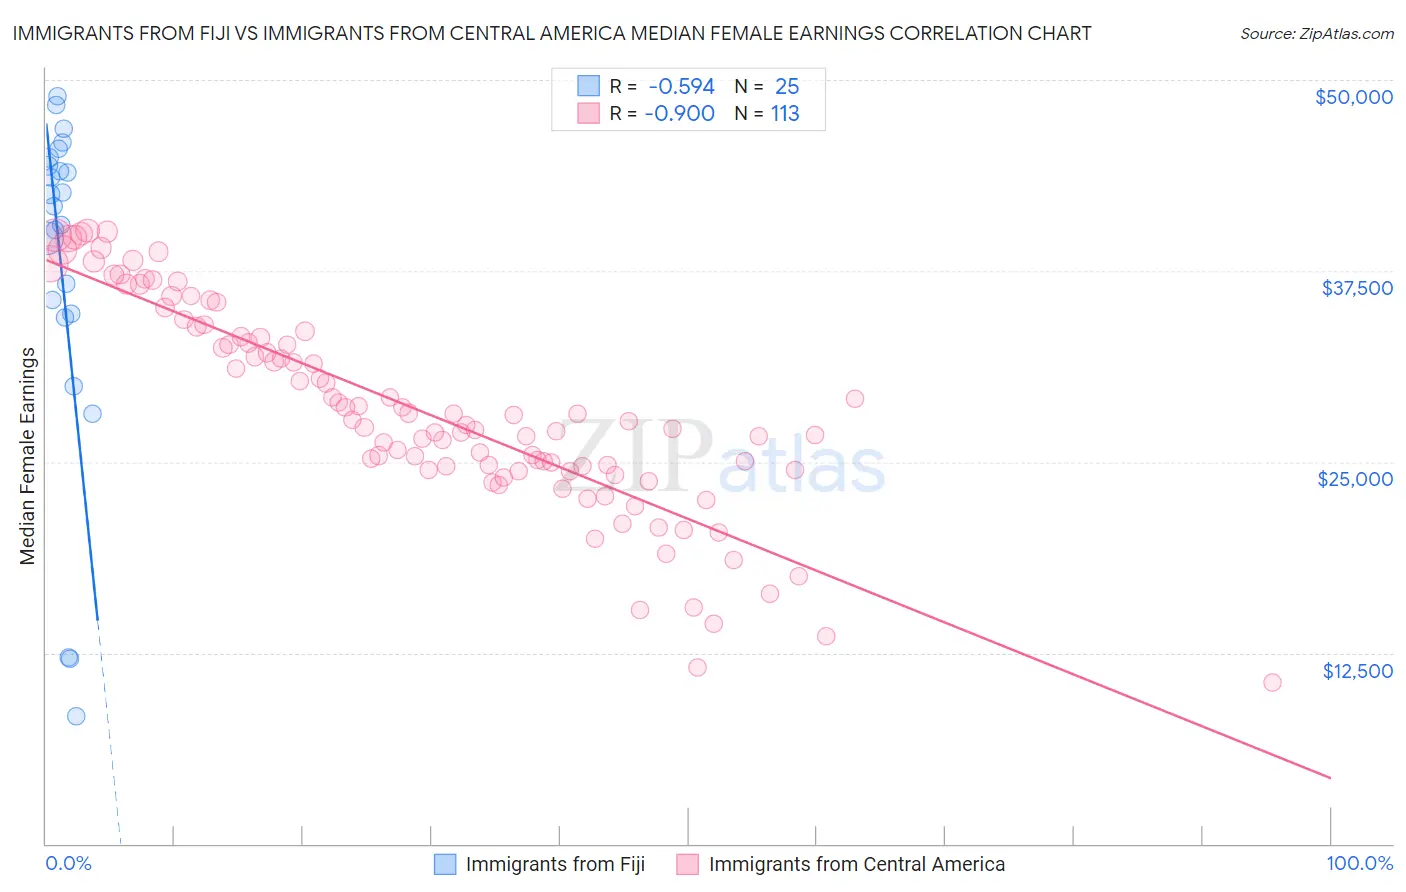
Immigrants from Fiji vs Immigrants from Central America Median Female Earnings Correlation Chart
The statistical analysis conducted on geographies consisting of 93,750,474 people shows a substantial negative correlation between the proportion of Immigrants from Fiji and median female earnings in the United States with a correlation coefficient (R) of -0.594 and weighted average of $41,656. Similarly, the statistical analysis conducted on geographies consisting of 535,445,485 people shows a near-perfect negative correlation between the proportion of Immigrants from Central America and median female earnings in the United States with a correlation coefficient (R) of -0.900 and weighted average of $33,953, a difference of 22.7%.
Median Female Earnings Correlation Summary
| Measurement | Immigrants from Fiji | Immigrants from Central America |
| Minimum | $8,380 | $10,532 |
| Maximum | $48,941 | $40,138 |
| Range | $40,561 | $29,606 |
| Mean | $37,439 | $28,383 |
| Median | $41,723 | $27,631 |
| Interquartile 25% (IQ1) | $34,596 | $24,472 |
| Interquartile 75% (IQ3) | $44,642 | $33,368 |
| Interquartile Range (IQR) | $10,046 | $8,895 |
| Standard Deviation (Sample) | $11,332 | $6,771 |
| Standard Deviation (Population) | $11,103 | $6,741 |
Similar Demographics by Median Female Earnings
Demographics Similar to Immigrants from Fiji by Median Female Earnings
In terms of median female earnings, the demographic groups most similar to Immigrants from Fiji are Romanian ($41,663, a difference of 0.020%), Immigrants from Poland ($41,630, a difference of 0.060%), Immigrants from Barbados ($41,685, a difference of 0.070%), Immigrants from Argentina ($41,554, a difference of 0.25%), and Immigrants from Scotland ($41,771, a difference of 0.28%).
| Demographics | Rating | Rank | Median Female Earnings |
| Moroccans | 98.9 /100 | #94 | Exceptional $41,872 |
| Immigrants | Netherlands | 98.9 /100 | #95 | Exceptional $41,870 |
| South Africans | 98.8 /100 | #96 | Exceptional $41,825 |
| Immigrants | Hungary | 98.8 /100 | #97 | Exceptional $41,820 |
| Immigrants | Scotland | 98.7 /100 | #98 | Exceptional $41,771 |
| Immigrants | Barbados | 98.4 /100 | #99 | Exceptional $41,685 |
| Romanians | 98.3 /100 | #100 | Exceptional $41,663 |
| Immigrants | Fiji | 98.3 /100 | #101 | Exceptional $41,656 |
| Immigrants | Poland | 98.2 /100 | #102 | Exceptional $41,630 |
| Immigrants | Argentina | 97.9 /100 | #103 | Exceptional $41,554 |
| Immigrants | Zimbabwe | 97.8 /100 | #104 | Exceptional $41,527 |
| Italians | 97.7 /100 | #105 | Exceptional $41,505 |
| Immigrants | Eritrea | 97.6 /100 | #106 | Exceptional $41,485 |
| Palestinians | 97.6 /100 | #107 | Exceptional $41,484 |
| Jordanians | 97.5 /100 | #108 | Exceptional $41,464 |
Demographics Similar to Immigrants from Central America by Median Female Earnings
In terms of median female earnings, the demographic groups most similar to Immigrants from Central America are Hopi ($33,932, a difference of 0.060%), Menominee ($33,894, a difference of 0.17%), Cajun ($34,034, a difference of 0.24%), Kiowa ($34,074, a difference of 0.36%), and Native/Alaskan ($33,806, a difference of 0.43%).
| Demographics | Rating | Rank | Median Female Earnings |
| Hispanics or Latinos | 0.0 /100 | #321 | Tragic $34,421 |
| Chickasaw | 0.0 /100 | #322 | Tragic $34,414 |
| Seminole | 0.0 /100 | #323 | Tragic $34,385 |
| Immigrants | Congo | 0.0 /100 | #324 | Tragic $34,317 |
| Dutch West Indians | 0.0 /100 | #325 | Tragic $34,106 |
| Kiowa | 0.0 /100 | #326 | Tragic $34,074 |
| Cajuns | 0.0 /100 | #327 | Tragic $34,034 |
| Immigrants | Central America | 0.0 /100 | #328 | Tragic $33,953 |
| Hopi | 0.0 /100 | #329 | Tragic $33,932 |
| Menominee | 0.0 /100 | #330 | Tragic $33,894 |
| Natives/Alaskans | 0.0 /100 | #331 | Tragic $33,806 |
| Choctaw | 0.0 /100 | #332 | Tragic $33,775 |
| Mexicans | 0.0 /100 | #333 | Tragic $33,664 |
| Spanish American Indians | 0.0 /100 | #334 | Tragic $33,625 |
| Creek | 0.0 /100 | #335 | Tragic $33,437 |