Immigrants from Fiji vs Immigrants from Korea Median Female Earnings
COMPARE
Immigrants from Fiji
Immigrants from Korea
Median Female Earnings
Median Female Earnings Comparison
Immigrants from Fiji
Immigrants from Korea
$41,656
MEDIAN FEMALE EARNINGS
98.3/ 100
METRIC RATING
101st/ 347
METRIC RANK
$44,847
MEDIAN FEMALE EARNINGS
100.0/ 100
METRIC RATING
24th/ 347
METRIC RANK
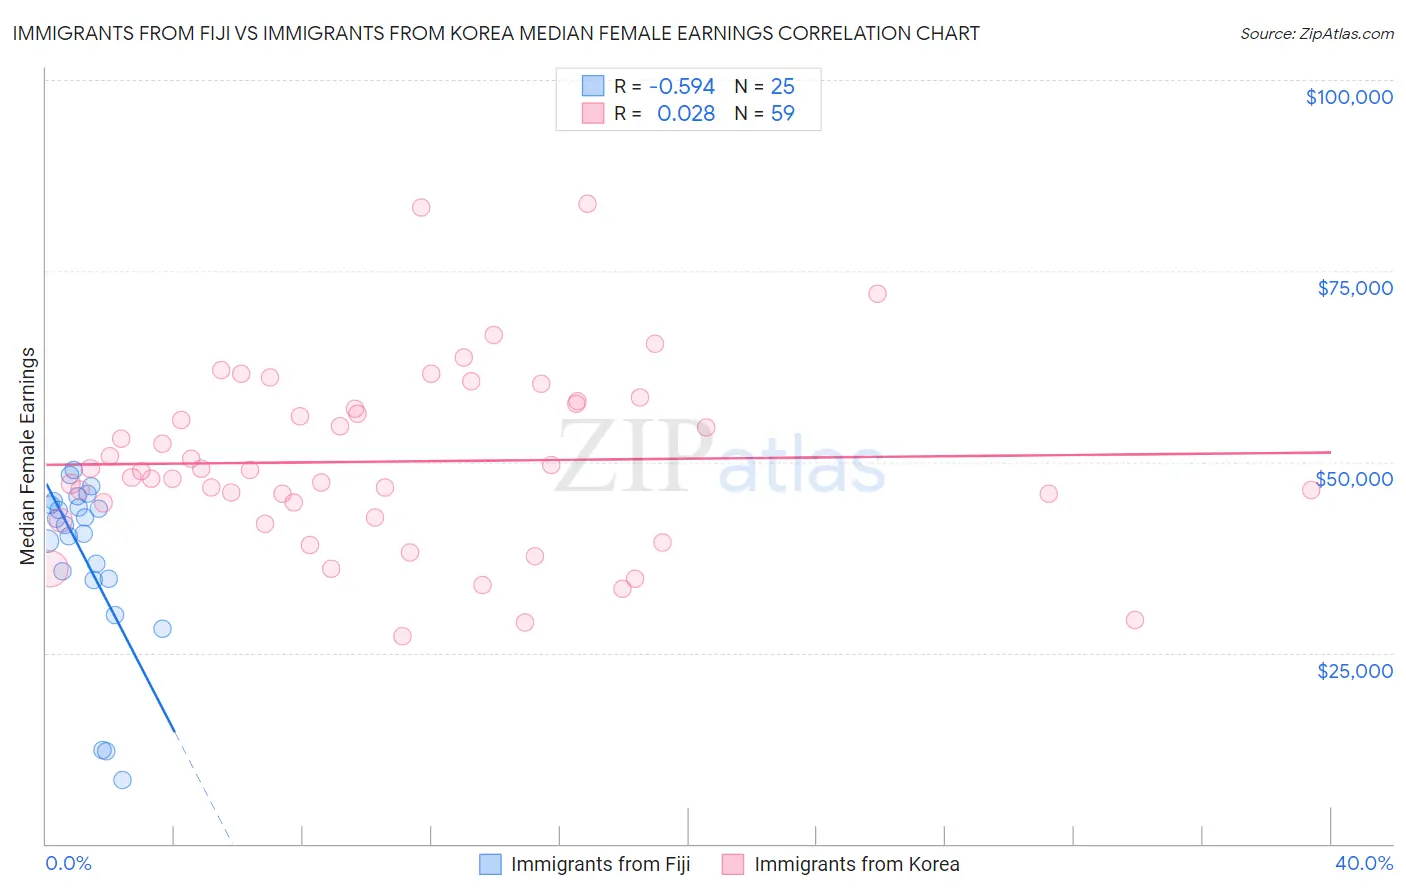
Immigrants from Fiji vs Immigrants from Korea Median Female Earnings Correlation Chart
The statistical analysis conducted on geographies consisting of 93,750,474 people shows a substantial negative correlation between the proportion of Immigrants from Fiji and median female earnings in the United States with a correlation coefficient (R) of -0.594 and weighted average of $41,656. Similarly, the statistical analysis conducted on geographies consisting of 416,108,696 people shows no correlation between the proportion of Immigrants from Korea and median female earnings in the United States with a correlation coefficient (R) of 0.028 and weighted average of $44,847, a difference of 7.7%.
Median Female Earnings Correlation Summary
| Measurement | Immigrants from Fiji | Immigrants from Korea |
| Minimum | $8,380 | $27,183 |
| Maximum | $48,941 | $83,750 |
| Range | $40,561 | $56,567 |
| Mean | $37,439 | $50,048 |
| Median | $41,723 | $48,754 |
| Interquartile 25% (IQ1) | $34,596 | $42,787 |
| Interquartile 75% (IQ3) | $44,642 | $57,558 |
| Interquartile Range (IQR) | $10,046 | $14,771 |
| Standard Deviation (Sample) | $11,332 | $11,764 |
| Standard Deviation (Population) | $11,103 | $11,664 |
Similar Demographics by Median Female Earnings
Demographics Similar to Immigrants from Fiji by Median Female Earnings
In terms of median female earnings, the demographic groups most similar to Immigrants from Fiji are Romanian ($41,663, a difference of 0.020%), Immigrants from Poland ($41,630, a difference of 0.060%), Immigrants from Barbados ($41,685, a difference of 0.070%), Immigrants from Argentina ($41,554, a difference of 0.25%), and Immigrants from Scotland ($41,771, a difference of 0.28%).
| Demographics | Rating | Rank | Median Female Earnings |
| Moroccans | 98.9 /100 | #94 | Exceptional $41,872 |
| Immigrants | Netherlands | 98.9 /100 | #95 | Exceptional $41,870 |
| South Africans | 98.8 /100 | #96 | Exceptional $41,825 |
| Immigrants | Hungary | 98.8 /100 | #97 | Exceptional $41,820 |
| Immigrants | Scotland | 98.7 /100 | #98 | Exceptional $41,771 |
| Immigrants | Barbados | 98.4 /100 | #99 | Exceptional $41,685 |
| Romanians | 98.3 /100 | #100 | Exceptional $41,663 |
| Immigrants | Fiji | 98.3 /100 | #101 | Exceptional $41,656 |
| Immigrants | Poland | 98.2 /100 | #102 | Exceptional $41,630 |
| Immigrants | Argentina | 97.9 /100 | #103 | Exceptional $41,554 |
| Immigrants | Zimbabwe | 97.8 /100 | #104 | Exceptional $41,527 |
| Italians | 97.7 /100 | #105 | Exceptional $41,505 |
| Immigrants | Eritrea | 97.6 /100 | #106 | Exceptional $41,485 |
| Palestinians | 97.6 /100 | #107 | Exceptional $41,484 |
| Jordanians | 97.5 /100 | #108 | Exceptional $41,464 |
Demographics Similar to Immigrants from Korea by Median Female Earnings
In terms of median female earnings, the demographic groups most similar to Immigrants from Korea are Burmese ($44,911, a difference of 0.14%), Immigrants from Sweden ($44,774, a difference of 0.16%), Immigrants from Belarus ($44,757, a difference of 0.20%), Immigrants from Greece ($44,976, a difference of 0.29%), and Turkish ($44,695, a difference of 0.34%).
| Demographics | Rating | Rank | Median Female Earnings |
| Immigrants | South Central Asia | 100.0 /100 | #17 | Exceptional $46,324 |
| Cypriots | 100.0 /100 | #18 | Exceptional $45,570 |
| Eastern Europeans | 100.0 /100 | #19 | Exceptional $45,385 |
| Immigrants | Japan | 100.0 /100 | #20 | Exceptional $45,323 |
| Cambodians | 100.0 /100 | #21 | Exceptional $45,014 |
| Immigrants | Greece | 100.0 /100 | #22 | Exceptional $44,976 |
| Burmese | 100.0 /100 | #23 | Exceptional $44,911 |
| Immigrants | Korea | 100.0 /100 | #24 | Exceptional $44,847 |
| Immigrants | Sweden | 100.0 /100 | #25 | Exceptional $44,774 |
| Immigrants | Belarus | 100.0 /100 | #26 | Exceptional $44,757 |
| Turks | 100.0 /100 | #27 | Exceptional $44,695 |
| Immigrants | Russia | 100.0 /100 | #28 | Exceptional $44,680 |
| Immigrants | Belgium | 100.0 /100 | #29 | Exceptional $44,587 |
| Asians | 100.0 /100 | #30 | Exceptional $44,586 |
| Immigrants | France | 100.0 /100 | #31 | Exceptional $44,541 |