Immigrants from Fiji vs Immigrants from Central America 5th Grade
COMPARE
Immigrants from Fiji
Immigrants from Central America
5th Grade
5th Grade Comparison
Immigrants from Fiji
Immigrants from Central America
95.6%
5TH GRADE
0.0/ 100
METRIC RATING
323rd/ 347
METRIC RANK
94.7%
5TH GRADE
0.0/ 100
METRIC RATING
342nd/ 347
METRIC RANK
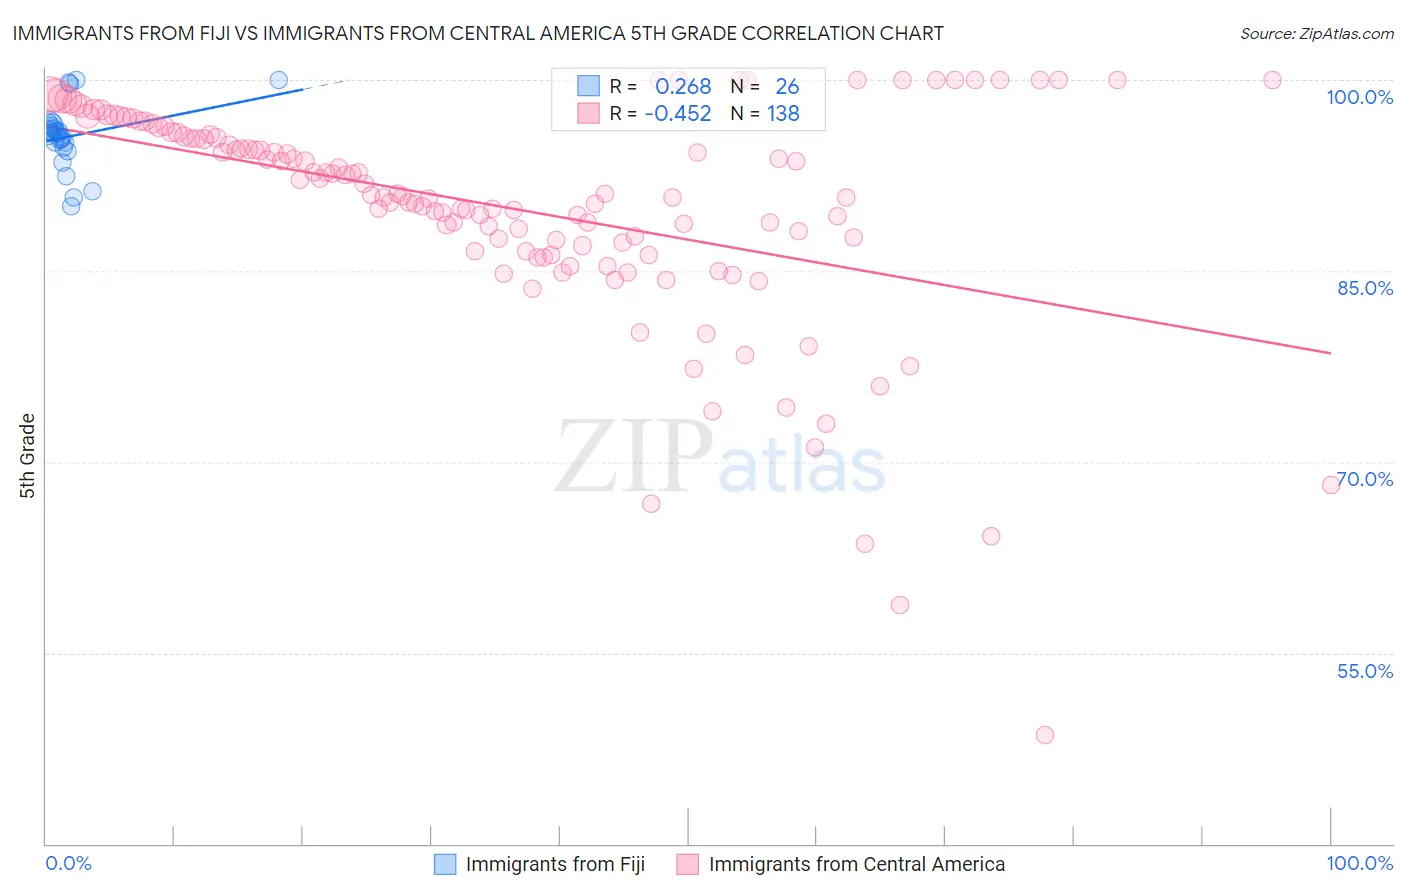
Immigrants from Fiji vs Immigrants from Central America 5th Grade Correlation Chart
The statistical analysis conducted on geographies consisting of 93,756,204 people shows a weak positive correlation between the proportion of Immigrants from Fiji and percentage of population with at least 5th grade education in the United States with a correlation coefficient (R) of 0.268 and weighted average of 95.6%. Similarly, the statistical analysis conducted on geographies consisting of 536,554,577 people shows a moderate negative correlation between the proportion of Immigrants from Central America and percentage of population with at least 5th grade education in the United States with a correlation coefficient (R) of -0.452 and weighted average of 94.7%, a difference of 0.98%.
5th Grade Correlation Summary
| Measurement | Immigrants from Fiji | Immigrants from Central America |
| Minimum | 90.1% | 48.6% |
| Maximum | 100.0% | 100.0% |
| Range | 9.9% | 51.4% |
| Mean | 95.6% | 90.0% |
| Median | 95.8% | 91.0% |
| Interquartile 25% (IQ1) | 94.7% | 87.0% |
| Interquartile 75% (IQ3) | 96.4% | 95.9% |
| Interquartile Range (IQR) | 1.6% | 8.9% |
| Standard Deviation (Sample) | 2.6% | 8.8% |
| Standard Deviation (Population) | 2.5% | 8.8% |
Demographics Similar to Immigrants from Fiji and Immigrants from Central America by 5th Grade
In terms of 5th grade, the demographic groups most similar to Immigrants from Fiji are Honduran (95.6%, a difference of 0.020%), Hispanic or Latino (95.6%, a difference of 0.020%), Immigrants from Nicaragua (95.6%, a difference of 0.050%), Immigrants from Cambodia (95.5%, a difference of 0.050%), and Dominican (95.5%, a difference of 0.050%). Similarly, the demographic groups most similar to Immigrants from Central America are Yakama (94.8%, a difference of 0.10%), Guatemalan (94.8%, a difference of 0.18%), Immigrants from Yemen (94.9%, a difference of 0.21%), Immigrants from Cabo Verde (94.9%, a difference of 0.25%), and Central American (95.1%, a difference of 0.42%).
| Demographics | Rating | Rank | 5th Grade |
| Immigrants | Nicaragua | 0.0 /100 | #322 | Tragic 95.6% |
| Immigrants | Fiji | 0.0 /100 | #323 | Tragic 95.6% |
| Hondurans | 0.0 /100 | #324 | Tragic 95.6% |
| Hispanics or Latinos | 0.0 /100 | #325 | Tragic 95.6% |
| Immigrants | Cambodia | 0.0 /100 | #326 | Tragic 95.5% |
| Dominicans | 0.0 /100 | #327 | Tragic 95.5% |
| Cape Verdeans | 0.0 /100 | #328 | Tragic 95.5% |
| Mexican American Indians | 0.0 /100 | #329 | Tragic 95.5% |
| Immigrants | Armenia | 0.0 /100 | #330 | Tragic 95.4% |
| Immigrants | Honduras | 0.0 /100 | #331 | Tragic 95.4% |
| Immigrants | Dominican Republic | 0.0 /100 | #332 | Tragic 95.3% |
| Immigrants | Latin America | 0.0 /100 | #333 | Tragic 95.3% |
| Nepalese | 0.0 /100 | #334 | Tragic 95.2% |
| Mexicans | 0.0 /100 | #335 | Tragic 95.2% |
| Immigrants | Azores | 0.0 /100 | #336 | Tragic 95.1% |
| Central Americans | 0.0 /100 | #337 | Tragic 95.1% |
| Immigrants | Cabo Verde | 0.0 /100 | #338 | Tragic 94.9% |
| Immigrants | Yemen | 0.0 /100 | #339 | Tragic 94.9% |
| Guatemalans | 0.0 /100 | #340 | Tragic 94.8% |
| Yakama | 0.0 /100 | #341 | Tragic 94.8% |
| Immigrants | Central America | 0.0 /100 | #342 | Tragic 94.7% |