Samoan vs Immigrants from Central America Median Female Earnings
COMPARE
Samoan
Immigrants from Central America
Median Female Earnings
Median Female Earnings Comparison
Samoans
Immigrants from Central America
$37,498
MEDIAN FEMALE EARNINGS
1.0/ 100
METRIC RATING
256th/ 347
METRIC RANK
$33,953
MEDIAN FEMALE EARNINGS
0.0/ 100
METRIC RATING
328th/ 347
METRIC RANK
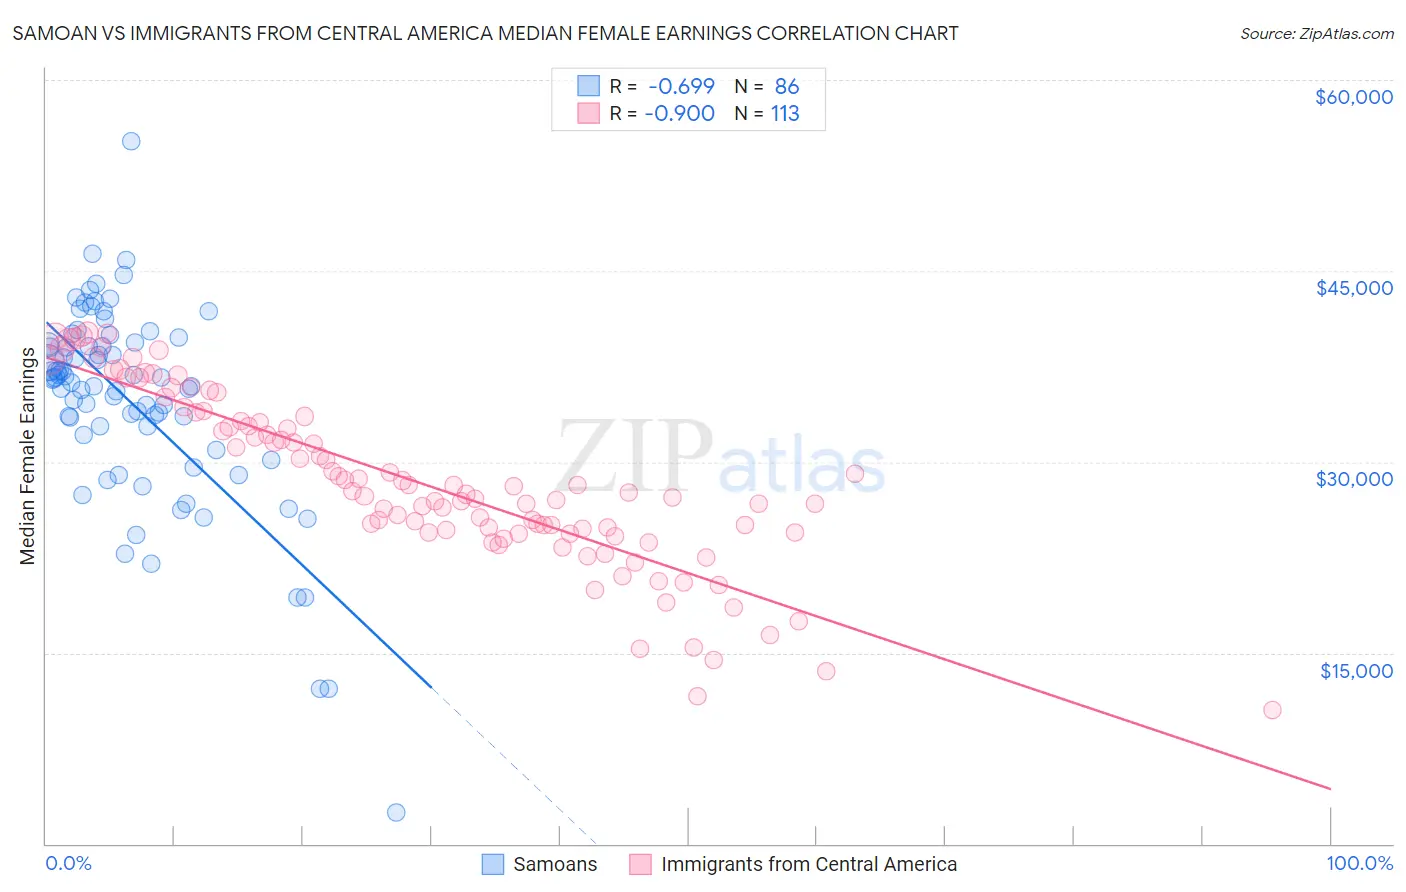
Samoan vs Immigrants from Central America Median Female Earnings Correlation Chart
The statistical analysis conducted on geographies consisting of 225,122,971 people shows a significant negative correlation between the proportion of Samoans and median female earnings in the United States with a correlation coefficient (R) of -0.699 and weighted average of $37,498. Similarly, the statistical analysis conducted on geographies consisting of 535,445,485 people shows a near-perfect negative correlation between the proportion of Immigrants from Central America and median female earnings in the United States with a correlation coefficient (R) of -0.900 and weighted average of $33,953, a difference of 10.4%.
Median Female Earnings Correlation Summary
| Measurement | Samoan | Immigrants from Central America |
| Minimum | $2,499 | $10,532 |
| Maximum | $55,213 | $40,138 |
| Range | $52,714 | $29,606 |
| Mean | $34,701 | $28,383 |
| Median | $36,357 | $27,631 |
| Interquartile 25% (IQ1) | $32,098 | $24,472 |
| Interquartile 75% (IQ3) | $39,275 | $33,368 |
| Interquartile Range (IQR) | $7,177 | $8,895 |
| Standard Deviation (Sample) | $8,002 | $6,771 |
| Standard Deviation (Population) | $7,955 | $6,741 |
Similar Demographics by Median Female Earnings
Demographics Similar to Samoans by Median Female Earnings
In terms of median female earnings, the demographic groups most similar to Samoans are Hawaiian ($37,497, a difference of 0.0%), Colville ($37,514, a difference of 0.040%), White/Caucasian ($37,531, a difference of 0.090%), Belizean ($37,429, a difference of 0.19%), and Scotch-Irish ($37,383, a difference of 0.31%).
| Demographics | Rating | Rank | Median Female Earnings |
| Swiss | 2.3 /100 | #249 | Tragic $37,904 |
| Immigrants | Iraq | 2.2 /100 | #250 | Tragic $37,864 |
| Welsh | 2.1 /100 | #251 | Tragic $37,856 |
| Immigrants | Dominica | 2.0 /100 | #252 | Tragic $37,825 |
| Danes | 1.6 /100 | #253 | Tragic $37,730 |
| Whites/Caucasians | 1.1 /100 | #254 | Tragic $37,531 |
| Colville | 1.1 /100 | #255 | Tragic $37,514 |
| Samoans | 1.0 /100 | #256 | Tragic $37,498 |
| Hawaiians | 1.0 /100 | #257 | Tragic $37,497 |
| Belizeans | 0.9 /100 | #258 | Tragic $37,429 |
| Scotch-Irish | 0.8 /100 | #259 | Tragic $37,383 |
| Dutch | 0.7 /100 | #260 | Tragic $37,339 |
| Malaysians | 0.7 /100 | #261 | Tragic $37,298 |
| Venezuelans | 0.7 /100 | #262 | Tragic $37,282 |
| German Russians | 0.5 /100 | #263 | Tragic $37,105 |
Demographics Similar to Immigrants from Central America by Median Female Earnings
In terms of median female earnings, the demographic groups most similar to Immigrants from Central America are Hopi ($33,932, a difference of 0.060%), Menominee ($33,894, a difference of 0.17%), Cajun ($34,034, a difference of 0.24%), Kiowa ($34,074, a difference of 0.36%), and Native/Alaskan ($33,806, a difference of 0.43%).
| Demographics | Rating | Rank | Median Female Earnings |
| Hispanics or Latinos | 0.0 /100 | #321 | Tragic $34,421 |
| Chickasaw | 0.0 /100 | #322 | Tragic $34,414 |
| Seminole | 0.0 /100 | #323 | Tragic $34,385 |
| Immigrants | Congo | 0.0 /100 | #324 | Tragic $34,317 |
| Dutch West Indians | 0.0 /100 | #325 | Tragic $34,106 |
| Kiowa | 0.0 /100 | #326 | Tragic $34,074 |
| Cajuns | 0.0 /100 | #327 | Tragic $34,034 |
| Immigrants | Central America | 0.0 /100 | #328 | Tragic $33,953 |
| Hopi | 0.0 /100 | #329 | Tragic $33,932 |
| Menominee | 0.0 /100 | #330 | Tragic $33,894 |
| Natives/Alaskans | 0.0 /100 | #331 | Tragic $33,806 |
| Choctaw | 0.0 /100 | #332 | Tragic $33,775 |
| Mexicans | 0.0 /100 | #333 | Tragic $33,664 |
| Spanish American Indians | 0.0 /100 | #334 | Tragic $33,625 |
| Creek | 0.0 /100 | #335 | Tragic $33,437 |