Immigrants from Eritrea vs White/Caucasian Householder Income Under 25 years
COMPARE
Immigrants from Eritrea
White/Caucasian
Householder Income Under 25 years
Householder Income Under 25 years Comparison
Immigrants from Eritrea
Whites/Caucasians
$51,574
HOUSEHOLDER INCOME UNDER 25 YEARS
18.1/ 100
METRIC RATING
193rd/ 347
METRIC RANK
$50,336
HOUSEHOLDER INCOME UNDER 25 YEARS
1.1/ 100
METRIC RATING
258th/ 347
METRIC RANK
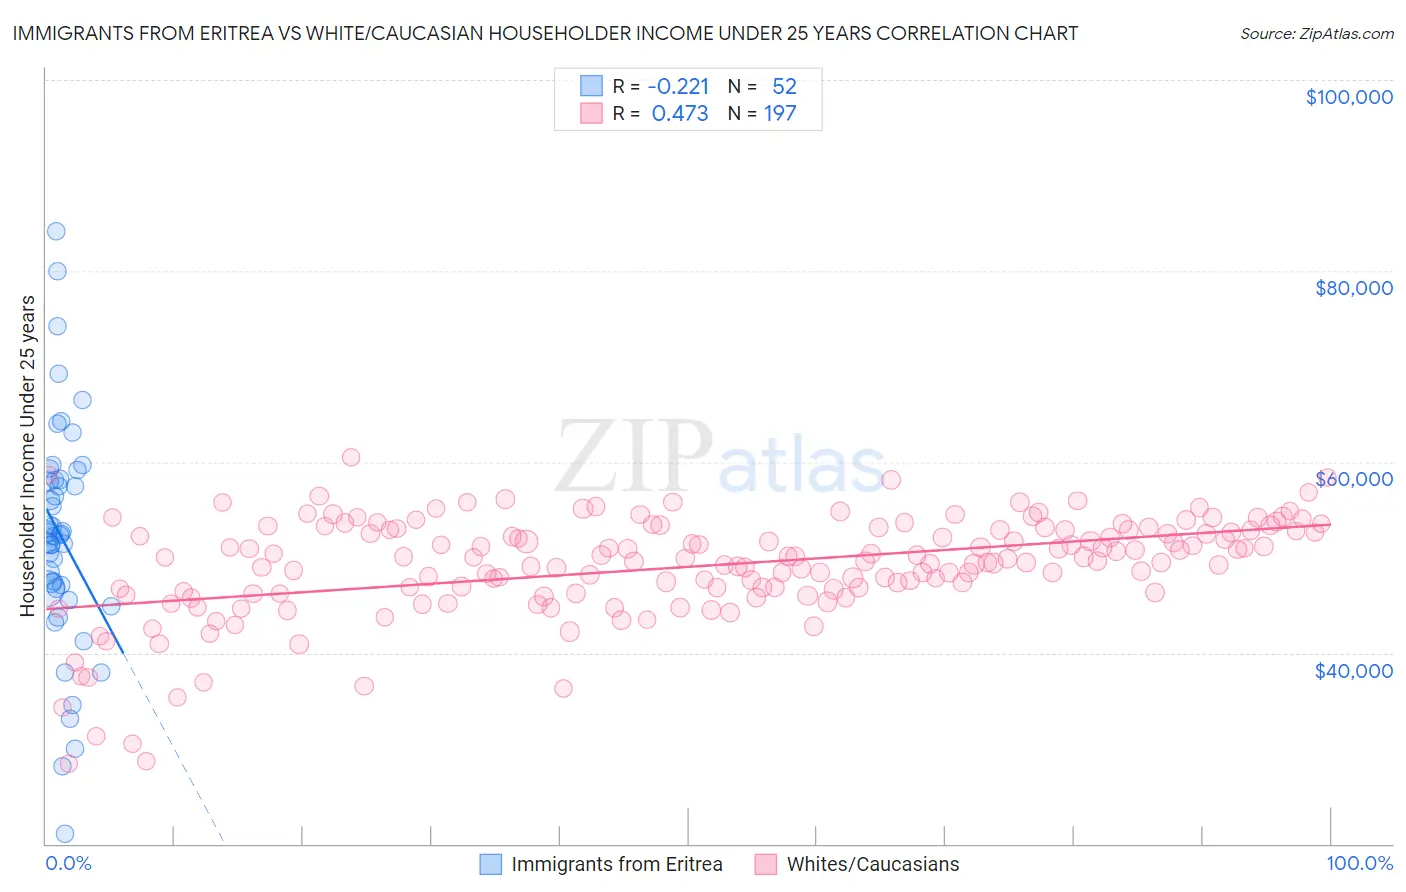
Immigrants from Eritrea vs White/Caucasian Householder Income Under 25 years Correlation Chart
The statistical analysis conducted on geographies consisting of 99,007,133 people shows a weak negative correlation between the proportion of Immigrants from Eritrea and household income with householder under the age of 25 in the United States with a correlation coefficient (R) of -0.221 and weighted average of $51,574. Similarly, the statistical analysis conducted on geographies consisting of 438,814,939 people shows a moderate positive correlation between the proportion of Whites/Caucasians and household income with householder under the age of 25 in the United States with a correlation coefficient (R) of 0.473 and weighted average of $50,336, a difference of 2.5%.
Householder Income Under 25 years Correlation Summary
| Measurement | Immigrants from Eritrea | White/Caucasian |
| Minimum | $21,074 | $28,432 |
| Maximum | $84,198 | $60,456 |
| Range | $63,124 | $32,024 |
| Mean | $52,175 | $49,043 |
| Median | $52,401 | $49,887 |
| Interquartile 25% (IQ1) | $46,767 | $46,371 |
| Interquartile 75% (IQ3) | $58,140 | $52,865 |
| Interquartile Range (IQR) | $11,373 | $6,494 |
| Standard Deviation (Sample) | $11,915 | $5,415 |
| Standard Deviation (Population) | $11,800 | $5,401 |
Similar Demographics by Householder Income Under 25 years
Demographics Similar to Immigrants from Eritrea by Householder Income Under 25 years
In terms of householder income under 25 years, the demographic groups most similar to Immigrants from Eritrea are West Indian ($51,583, a difference of 0.020%), Panamanian ($51,611, a difference of 0.070%), Malaysian ($51,615, a difference of 0.080%), Guatemalan ($51,525, a difference of 0.090%), and Estonian ($51,523, a difference of 0.10%).
| Demographics | Rating | Rank | Householder Income Under 25 years |
| Alaskan Athabascans | 23.8 /100 | #186 | Fair $51,713 |
| Immigrants | South Africa | 23.4 /100 | #187 | Fair $51,705 |
| Northern Europeans | 22.2 /100 | #188 | Fair $51,678 |
| Croatians | 21.6 /100 | #189 | Fair $51,662 |
| Malaysians | 19.7 /100 | #190 | Poor $51,615 |
| Panamanians | 19.5 /100 | #191 | Poor $51,611 |
| West Indians | 18.5 /100 | #192 | Poor $51,583 |
| Immigrants | Eritrea | 18.1 /100 | #193 | Poor $51,574 |
| Guatemalans | 16.4 /100 | #194 | Poor $51,525 |
| Estonians | 16.4 /100 | #195 | Poor $51,523 |
| Palestinians | 16.1 /100 | #196 | Poor $51,515 |
| Pima | 15.7 /100 | #197 | Poor $51,503 |
| Immigrants | Syria | 15.4 /100 | #198 | Poor $51,494 |
| Swiss | 15.4 /100 | #199 | Poor $51,493 |
| Immigrants | West Indies | 14.9 /100 | #200 | Poor $51,479 |
Demographics Similar to Whites/Caucasians by Householder Income Under 25 years
In terms of householder income under 25 years, the demographic groups most similar to Whites/Caucasians are Lebanese ($50,355, a difference of 0.040%), Immigrants from Dominica ($50,301, a difference of 0.070%), Aleut ($50,377, a difference of 0.080%), Immigrants from Cuba ($50,374, a difference of 0.080%), and Luxembourger ($50,379, a difference of 0.090%).
| Demographics | Rating | Rank | Householder Income Under 25 years |
| Celtics | 1.4 /100 | #251 | Tragic $50,447 |
| Immigrants | Mexico | 1.3 /100 | #252 | Tragic $50,422 |
| Immigrants | Haiti | 1.2 /100 | #253 | Tragic $50,398 |
| Luxembourgers | 1.2 /100 | #254 | Tragic $50,379 |
| Aleuts | 1.2 /100 | #255 | Tragic $50,377 |
| Immigrants | Cuba | 1.2 /100 | #256 | Tragic $50,374 |
| Lebanese | 1.1 /100 | #257 | Tragic $50,355 |
| Whites/Caucasians | 1.1 /100 | #258 | Tragic $50,336 |
| Immigrants | Dominica | 1.0 /100 | #259 | Tragic $50,301 |
| Hispanics or Latinos | 0.9 /100 | #260 | Tragic $50,279 |
| Hungarians | 0.9 /100 | #261 | Tragic $50,247 |
| Haitians | 0.8 /100 | #262 | Tragic $50,231 |
| Immigrants | Dominican Republic | 0.8 /100 | #263 | Tragic $50,204 |
| Fijians | 0.6 /100 | #264 | Tragic $50,132 |
| Belgians | 0.6 /100 | #265 | Tragic $50,113 |