Norwegian vs White/Caucasian Householder Income Under 25 years
COMPARE
Norwegian
White/Caucasian
Householder Income Under 25 years
Householder Income Under 25 years Comparison
Norwegians
Whites/Caucasians
$53,127
HOUSEHOLDER INCOME UNDER 25 YEARS
90.8/ 100
METRIC RATING
138th/ 347
METRIC RANK
$50,336
HOUSEHOLDER INCOME UNDER 25 YEARS
1.1/ 100
METRIC RATING
258th/ 347
METRIC RANK
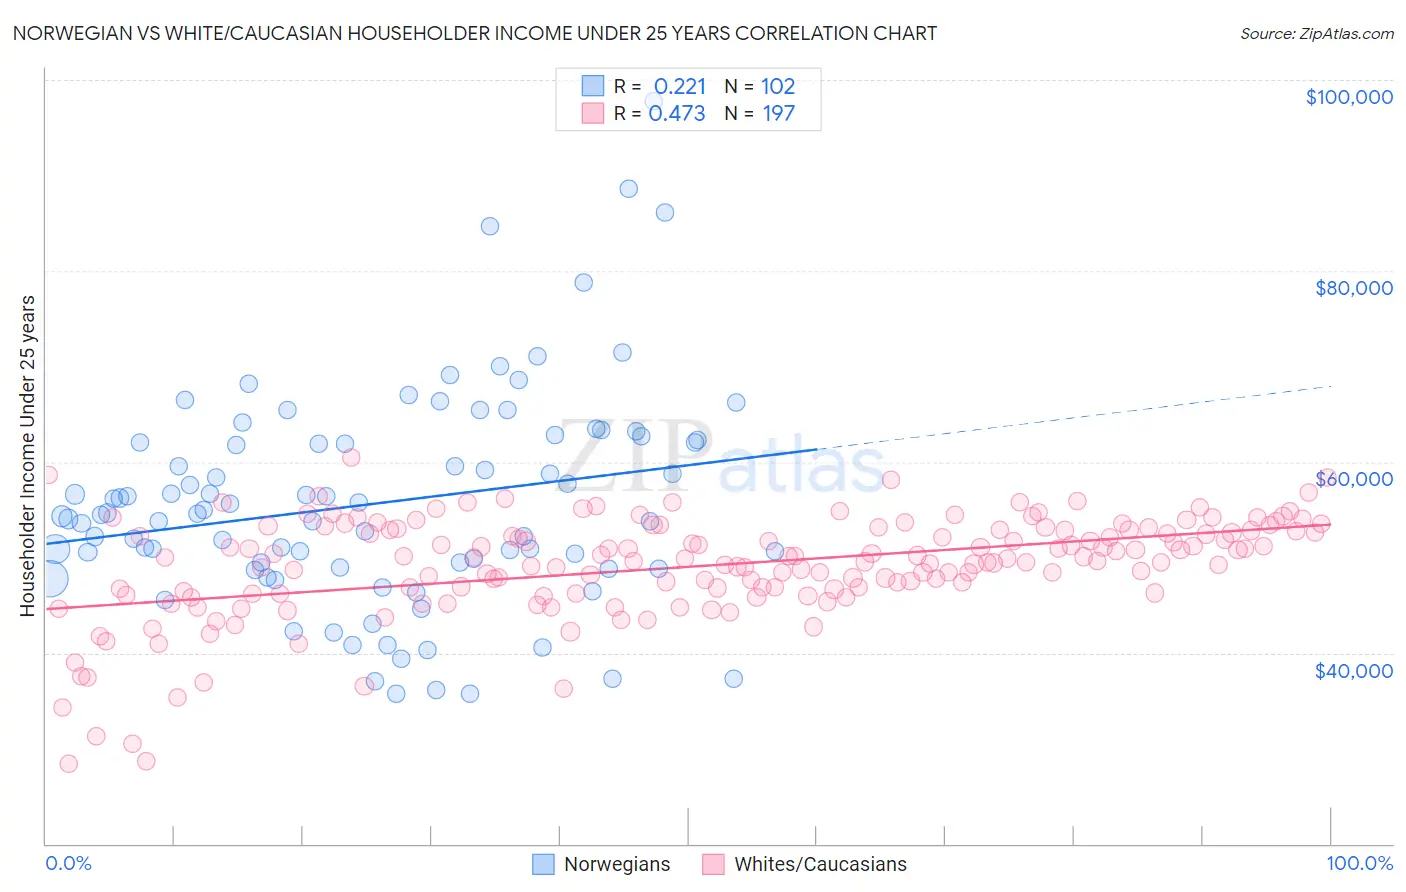
Norwegian vs White/Caucasian Householder Income Under 25 years Correlation Chart
The statistical analysis conducted on geographies consisting of 421,100,375 people shows a weak positive correlation between the proportion of Norwegians and household income with householder under the age of 25 in the United States with a correlation coefficient (R) of 0.221 and weighted average of $53,127. Similarly, the statistical analysis conducted on geographies consisting of 438,814,939 people shows a moderate positive correlation between the proportion of Whites/Caucasians and household income with householder under the age of 25 in the United States with a correlation coefficient (R) of 0.473 and weighted average of $50,336, a difference of 5.6%.
Householder Income Under 25 years Correlation Summary
| Measurement | Norwegian | White/Caucasian |
| Minimum | $35,753 | $28,432 |
| Maximum | $97,750 | $60,456 |
| Range | $61,997 | $32,024 |
| Mean | $55,657 | $49,043 |
| Median | $54,551 | $49,887 |
| Interquartile 25% (IQ1) | $48,924 | $46,371 |
| Interquartile 75% (IQ3) | $62,074 | $52,865 |
| Interquartile Range (IQR) | $13,150 | $6,494 |
| Standard Deviation (Sample) | $11,328 | $5,415 |
| Standard Deviation (Population) | $11,273 | $5,401 |
Similar Demographics by Householder Income Under 25 years
Demographics Similar to Norwegians by Householder Income Under 25 years
In terms of householder income under 25 years, the demographic groups most similar to Norwegians are Costa Rican ($53,106, a difference of 0.040%), Immigrants from Barbados ($53,163, a difference of 0.070%), Hawaiian ($53,078, a difference of 0.090%), Armenian ($53,179, a difference of 0.10%), and Immigrants from Northern Africa ($53,185, a difference of 0.11%).
| Demographics | Rating | Rank | Householder Income Under 25 years |
| Immigrants | Nicaragua | 93.3 /100 | #131 | Exceptional $53,266 |
| Moroccans | 93.1 /100 | #132 | Exceptional $53,256 |
| Immigrants | Immigrants | 92.2 /100 | #133 | Exceptional $53,201 |
| Immigrants | Northern Africa | 91.9 /100 | #134 | Exceptional $53,185 |
| Chileans | 91.9 /100 | #135 | Exceptional $53,185 |
| Armenians | 91.8 /100 | #136 | Exceptional $53,179 |
| Immigrants | Barbados | 91.5 /100 | #137 | Exceptional $53,163 |
| Norwegians | 90.8 /100 | #138 | Exceptional $53,127 |
| Costa Ricans | 90.4 /100 | #139 | Exceptional $53,106 |
| Hawaiians | 89.8 /100 | #140 | Excellent $53,078 |
| Danes | 88.9 /100 | #141 | Excellent $53,041 |
| Immigrants | Armenia | 87.5 /100 | #142 | Excellent $52,986 |
| Swedes | 87.5 /100 | #143 | Excellent $52,986 |
| South American Indians | 87.3 /100 | #144 | Excellent $52,979 |
| Immigrants | Western Europe | 86.7 /100 | #145 | Excellent $52,957 |
Demographics Similar to Whites/Caucasians by Householder Income Under 25 years
In terms of householder income under 25 years, the demographic groups most similar to Whites/Caucasians are Lebanese ($50,355, a difference of 0.040%), Immigrants from Dominica ($50,301, a difference of 0.070%), Aleut ($50,377, a difference of 0.080%), Immigrants from Cuba ($50,374, a difference of 0.080%), and Luxembourger ($50,379, a difference of 0.090%).
| Demographics | Rating | Rank | Householder Income Under 25 years |
| Celtics | 1.4 /100 | #251 | Tragic $50,447 |
| Immigrants | Mexico | 1.3 /100 | #252 | Tragic $50,422 |
| Immigrants | Haiti | 1.2 /100 | #253 | Tragic $50,398 |
| Luxembourgers | 1.2 /100 | #254 | Tragic $50,379 |
| Aleuts | 1.2 /100 | #255 | Tragic $50,377 |
| Immigrants | Cuba | 1.2 /100 | #256 | Tragic $50,374 |
| Lebanese | 1.1 /100 | #257 | Tragic $50,355 |
| Whites/Caucasians | 1.1 /100 | #258 | Tragic $50,336 |
| Immigrants | Dominica | 1.0 /100 | #259 | Tragic $50,301 |
| Hispanics or Latinos | 0.9 /100 | #260 | Tragic $50,279 |
| Hungarians | 0.9 /100 | #261 | Tragic $50,247 |
| Haitians | 0.8 /100 | #262 | Tragic $50,231 |
| Immigrants | Dominican Republic | 0.8 /100 | #263 | Tragic $50,204 |
| Fijians | 0.6 /100 | #264 | Tragic $50,132 |
| Belgians | 0.6 /100 | #265 | Tragic $50,113 |