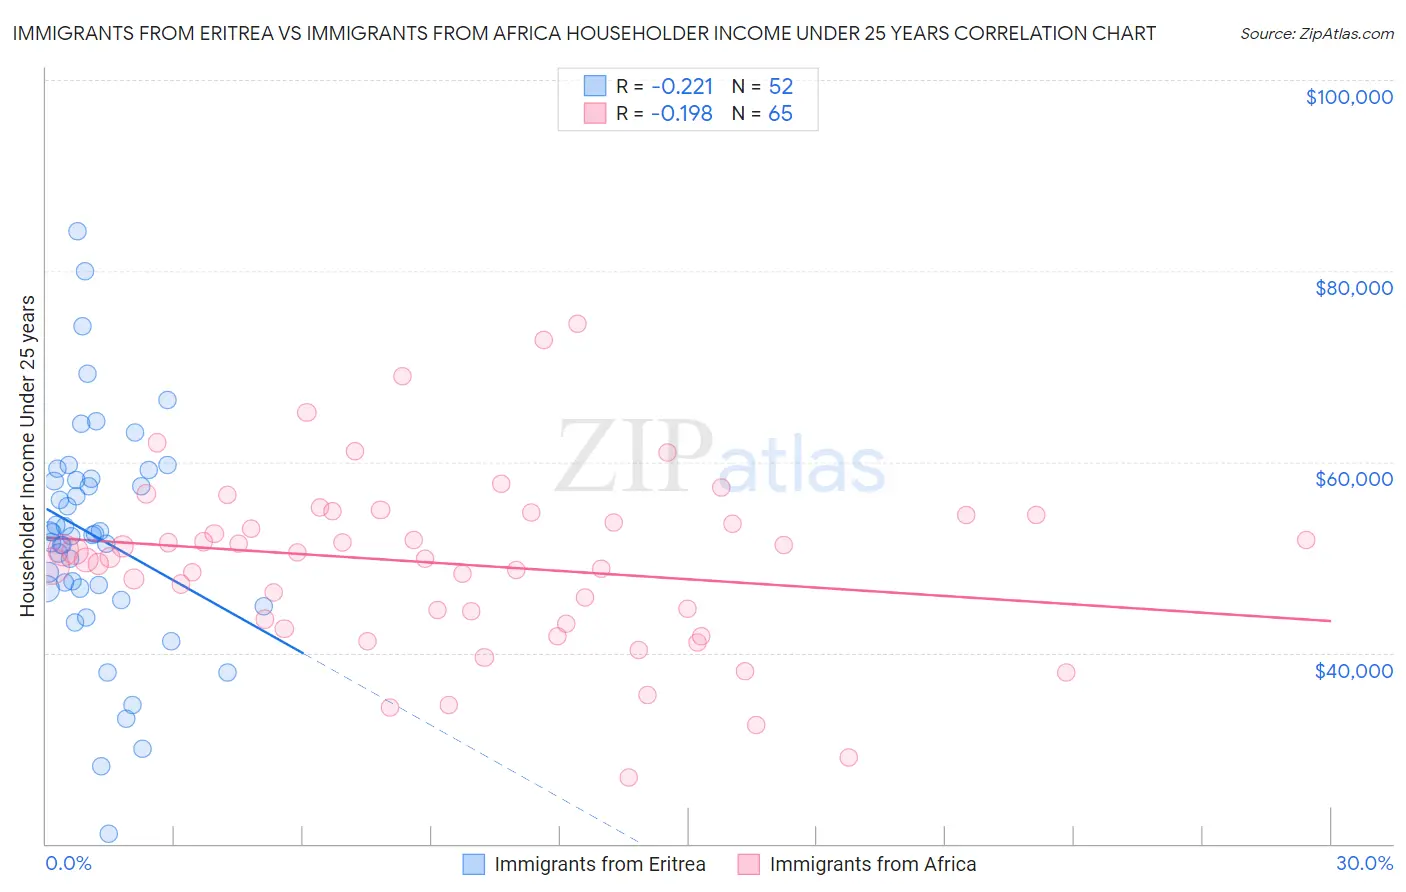
Immigrants from Eritrea vs Immigrants from Africa Householder Income Under 25 years
COMPARE
Immigrants from Eritrea
Immigrants from Africa
Householder Income Under 25 years
Householder Income Under 25 years Comparison
Immigrants from Eritrea
Immigrants from Africa
$51,574
HOUSEHOLDER INCOME UNDER 25 YEARS
18.1/ 100
METRIC RATING
193rd/ 347
METRIC RANK
$50,609
HOUSEHOLDER INCOME UNDER 25 YEARS
2.0/ 100
METRIC RATING
245th/ 347
METRIC RANK
Immigrants from Eritrea vs Immigrants from Africa Householder Income Under 25 years Correlation Chart
The statistical analysis conducted on geographies consisting of 99,007,133 people shows a weak negative correlation between the proportion of Immigrants from Eritrea and household income with householder under the age of 25 in the United States with a correlation coefficient (R) of -0.221 and weighted average of $51,574. Similarly, the statistical analysis conducted on geographies consisting of 387,551,997 people shows a poor negative correlation between the proportion of Immigrants from Africa and household income with householder under the age of 25 in the United States with a correlation coefficient (R) of -0.198 and weighted average of $50,609, a difference of 1.9%.
Householder Income Under 25 years Correlation Summary
| Measurement | Immigrants from Eritrea | Immigrants from Africa |
| Minimum | $21,074 | $26,950 |
| Maximum | $84,198 | $74,456 |
| Range | $63,124 | $47,507 |
| Mean | $52,175 | $49,315 |
| Median | $52,401 | $49,967 |
| Interquartile 25% (IQ1) | $46,767 | $43,274 |
| Interquartile 75% (IQ3) | $58,140 | $54,425 |
| Interquartile Range (IQR) | $11,373 | $11,151 |
| Standard Deviation (Sample) | $11,915 | $9,288 |
| Standard Deviation (Population) | $11,800 | $9,217 |
Similar Demographics by Householder Income Under 25 years
Demographics Similar to Immigrants from Eritrea by Householder Income Under 25 years
In terms of householder income under 25 years, the demographic groups most similar to Immigrants from Eritrea are West Indian ($51,583, a difference of 0.020%), Panamanian ($51,611, a difference of 0.070%), Malaysian ($51,615, a difference of 0.080%), Guatemalan ($51,525, a difference of 0.090%), and Estonian ($51,523, a difference of 0.10%).
| Demographics | Rating | Rank | Householder Income Under 25 years |
| Alaskan Athabascans | 23.8 /100 | #186 | Fair $51,713 |
| Immigrants | South Africa | 23.4 /100 | #187 | Fair $51,705 |
| Northern Europeans | 22.2 /100 | #188 | Fair $51,678 |
| Croatians | 21.6 /100 | #189 | Fair $51,662 |
| Malaysians | 19.7 /100 | #190 | Poor $51,615 |
| Panamanians | 19.5 /100 | #191 | Poor $51,611 |
| West Indians | 18.5 /100 | #192 | Poor $51,583 |
| Immigrants | Eritrea | 18.1 /100 | #193 | Poor $51,574 |
| Guatemalans | 16.4 /100 | #194 | Poor $51,525 |
| Estonians | 16.4 /100 | #195 | Poor $51,523 |
| Palestinians | 16.1 /100 | #196 | Poor $51,515 |
| Pima | 15.7 /100 | #197 | Poor $51,503 |
| Immigrants | Syria | 15.4 /100 | #198 | Poor $51,494 |
| Swiss | 15.4 /100 | #199 | Poor $51,493 |
| Immigrants | West Indies | 14.9 /100 | #200 | Poor $51,479 |
Demographics Similar to Immigrants from Africa by Householder Income Under 25 years
In terms of householder income under 25 years, the demographic groups most similar to Immigrants from Africa are Welsh ($50,597, a difference of 0.020%), Marshallese ($50,627, a difference of 0.040%), Immigrants from Thailand ($50,645, a difference of 0.070%), Cuban ($50,655, a difference of 0.090%), and Immigrants from Bosnia and Herzegovina ($50,565, a difference of 0.090%).
| Demographics | Rating | Rank | Householder Income Under 25 years |
| Iraqis | 3.2 /100 | #238 | Tragic $50,802 |
| Immigrants | Caribbean | 2.9 /100 | #239 | Tragic $50,757 |
| Immigrants | Lebanon | 2.7 /100 | #240 | Tragic $50,729 |
| Immigrants | Micronesia | 2.5 /100 | #241 | Tragic $50,691 |
| Cubans | 2.3 /100 | #242 | Tragic $50,655 |
| Immigrants | Thailand | 2.2 /100 | #243 | Tragic $50,645 |
| Marshallese | 2.1 /100 | #244 | Tragic $50,627 |
| Immigrants | Africa | 2.0 /100 | #245 | Tragic $50,609 |
| Welsh | 2.0 /100 | #246 | Tragic $50,597 |
| Immigrants | Bosnia and Herzegovina | 1.8 /100 | #247 | Tragic $50,565 |
| Slavs | 1.8 /100 | #248 | Tragic $50,563 |
| Scottish | 1.8 /100 | #249 | Tragic $50,554 |
| Immigrants | Cabo Verde | 1.7 /100 | #250 | Tragic $50,520 |
| Celtics | 1.4 /100 | #251 | Tragic $50,447 |
| Immigrants | Mexico | 1.3 /100 | #252 | Tragic $50,422 |