Slovak vs White/Caucasian Householder Income Under 25 years
COMPARE
Slovak
White/Caucasian
Householder Income Under 25 years
Householder Income Under 25 years Comparison
Slovaks
Whites/Caucasians
$49,753
HOUSEHOLDER INCOME UNDER 25 YEARS
0.3/ 100
METRIC RATING
273rd/ 347
METRIC RANK
$50,336
HOUSEHOLDER INCOME UNDER 25 YEARS
1.1/ 100
METRIC RATING
258th/ 347
METRIC RANK
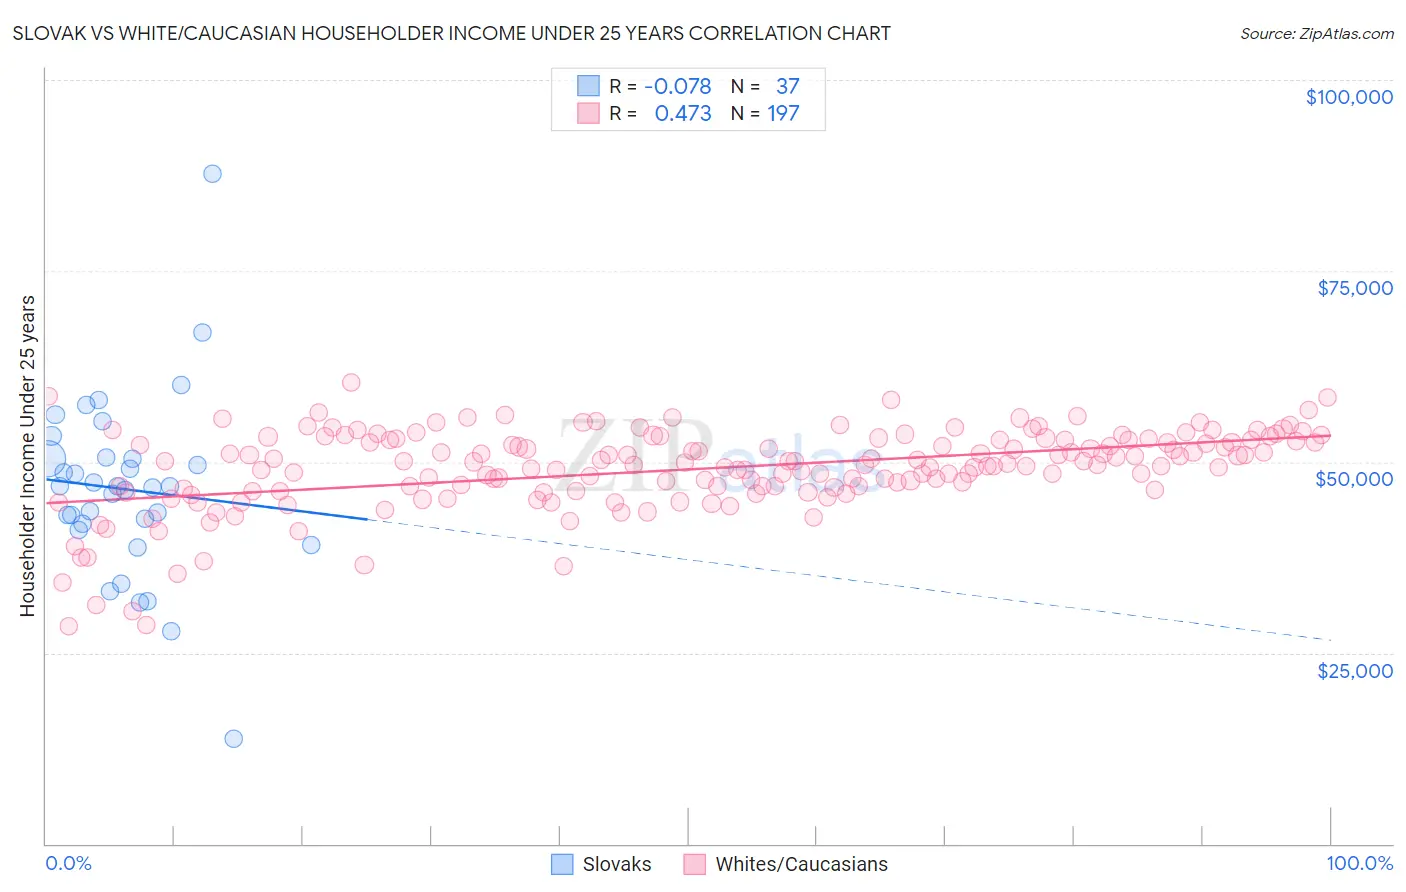
Slovak vs White/Caucasian Householder Income Under 25 years Correlation Chart
The statistical analysis conducted on geographies consisting of 328,630,657 people shows a slight negative correlation between the proportion of Slovaks and household income with householder under the age of 25 in the United States with a correlation coefficient (R) of -0.078 and weighted average of $49,753. Similarly, the statistical analysis conducted on geographies consisting of 438,814,939 people shows a moderate positive correlation between the proportion of Whites/Caucasians and household income with householder under the age of 25 in the United States with a correlation coefficient (R) of 0.473 and weighted average of $50,336, a difference of 1.2%.
Householder Income Under 25 years Correlation Summary
| Measurement | Slovak | White/Caucasian |
| Minimum | $13,750 | $28,432 |
| Maximum | $87,793 | $60,456 |
| Range | $74,043 | $32,024 |
| Mean | $46,421 | $49,043 |
| Median | $46,765 | $49,887 |
| Interquartile 25% (IQ1) | $41,531 | $46,371 |
| Interquartile 75% (IQ3) | $50,443 | $52,865 |
| Interquartile Range (IQR) | $8,912 | $6,494 |
| Standard Deviation (Sample) | $12,103 | $5,415 |
| Standard Deviation (Population) | $11,938 | $5,401 |
Demographics Similar to Slovaks and Whites/Caucasians by Householder Income Under 25 years
In terms of householder income under 25 years, the demographic groups most similar to Slovaks are Immigrants from Senegal ($49,742, a difference of 0.020%), Colville ($49,774, a difference of 0.040%), Taiwanese ($49,804, a difference of 0.10%), Immigrants from Kenya ($49,633, a difference of 0.24%), and Mexican ($49,989, a difference of 0.48%). Similarly, the demographic groups most similar to Whites/Caucasians are Lebanese ($50,355, a difference of 0.040%), Immigrants from Dominica ($50,301, a difference of 0.070%), Aleut ($50,377, a difference of 0.080%), Immigrants from Cuba ($50,374, a difference of 0.080%), and Hispanic or Latino ($50,279, a difference of 0.11%).
| Demographics | Rating | Rank | Householder Income Under 25 years |
| Aleuts | 1.2 /100 | #255 | Tragic $50,377 |
| Immigrants | Cuba | 1.2 /100 | #256 | Tragic $50,374 |
| Lebanese | 1.1 /100 | #257 | Tragic $50,355 |
| Whites/Caucasians | 1.1 /100 | #258 | Tragic $50,336 |
| Immigrants | Dominica | 1.0 /100 | #259 | Tragic $50,301 |
| Hispanics or Latinos | 0.9 /100 | #260 | Tragic $50,279 |
| Hungarians | 0.9 /100 | #261 | Tragic $50,247 |
| Haitians | 0.8 /100 | #262 | Tragic $50,231 |
| Immigrants | Dominican Republic | 0.8 /100 | #263 | Tragic $50,204 |
| Fijians | 0.6 /100 | #264 | Tragic $50,132 |
| Belgians | 0.6 /100 | #265 | Tragic $50,113 |
| Immigrants | Venezuela | 0.6 /100 | #266 | Tragic $50,109 |
| Immigrants | Laos | 0.5 /100 | #267 | Tragic $50,041 |
| Venezuelans | 0.5 /100 | #268 | Tragic $50,011 |
| Ute | 0.5 /100 | #269 | Tragic $49,997 |
| Mexicans | 0.5 /100 | #270 | Tragic $49,989 |
| Taiwanese | 0.3 /100 | #271 | Tragic $49,804 |
| Colville | 0.3 /100 | #272 | Tragic $49,774 |
| Slovaks | 0.3 /100 | #273 | Tragic $49,753 |
| Immigrants | Senegal | 0.3 /100 | #274 | Tragic $49,742 |
| Immigrants | Kenya | 0.2 /100 | #275 | Tragic $49,633 |