Immigrants from Eritrea vs White/Caucasian Unemployment Among Youth under 25 years
COMPARE
Immigrants from Eritrea
White/Caucasian
Unemployment Among Youth under 25 years
Unemployment Among Youth under 25 years Comparison
Immigrants from Eritrea
Whites/Caucasians
11.1%
UNEMPLOYMENT AMONG YOUTH UNDER 25 YEARS
98.8/ 100
METRIC RATING
57th/ 347
METRIC RANK
11.2%
UNEMPLOYMENT AMONG YOUTH UNDER 25 YEARS
96.9/ 100
METRIC RATING
77th/ 347
METRIC RANK
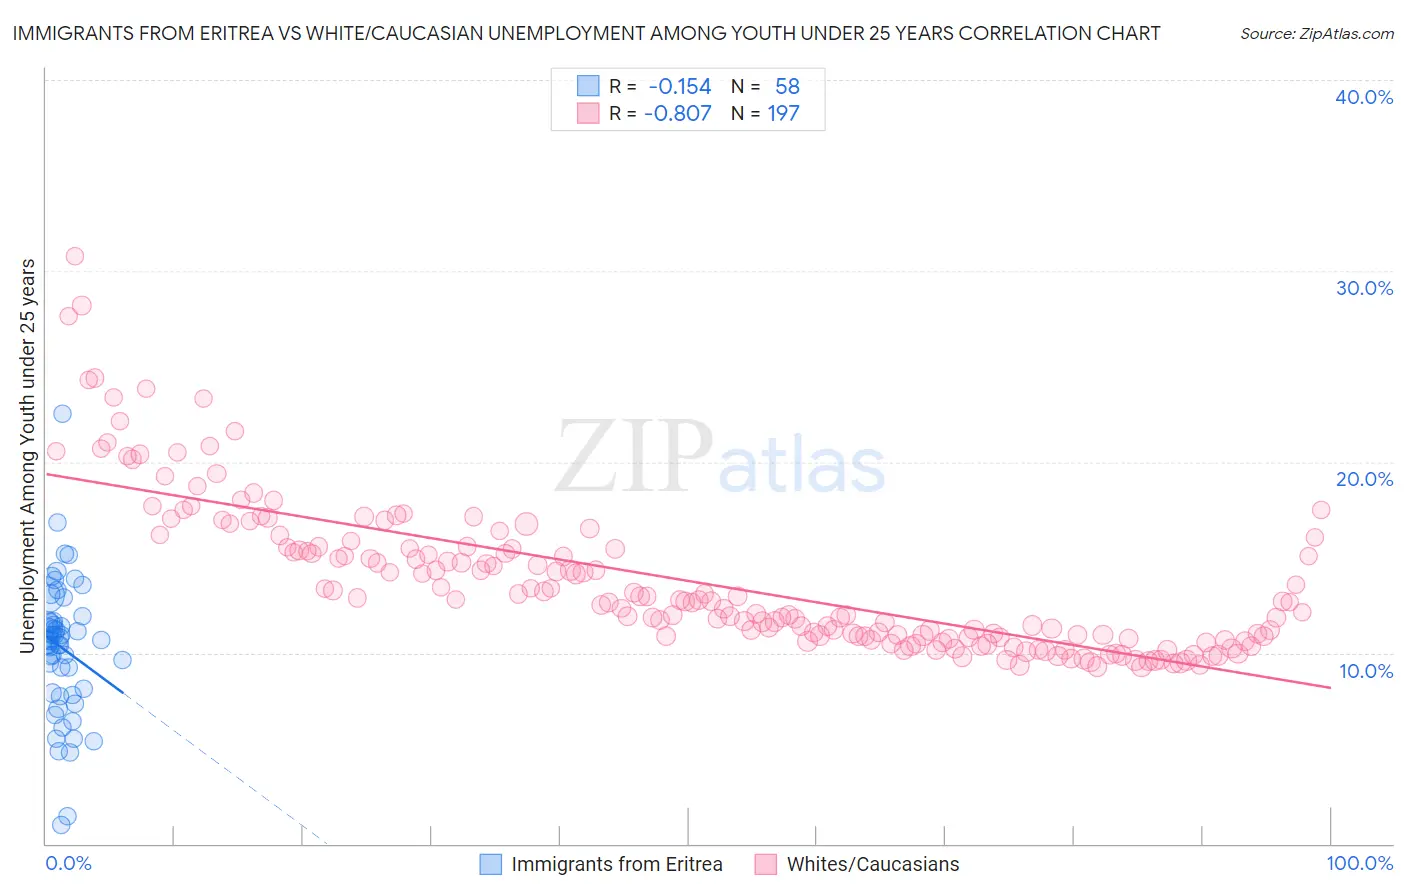
Immigrants from Eritrea vs White/Caucasian Unemployment Among Youth under 25 years Correlation Chart
The statistical analysis conducted on geographies consisting of 104,703,473 people shows a poor negative correlation between the proportion of Immigrants from Eritrea and unemployment rate among youth under the age of 25 in the United States with a correlation coefficient (R) of -0.154 and weighted average of 11.1%. Similarly, the statistical analysis conducted on geographies consisting of 555,079,229 people shows a very strong negative correlation between the proportion of Whites/Caucasians and unemployment rate among youth under the age of 25 in the United States with a correlation coefficient (R) of -0.807 and weighted average of 11.2%, a difference of 1.1%.
Unemployment Among Youth under 25 years Correlation Summary
| Measurement | Immigrants from Eritrea | White/Caucasian |
| Minimum | 1.0% | 9.2% |
| Maximum | 22.5% | 30.8% |
| Range | 21.5% | 21.5% |
| Mean | 10.2% | 13.7% |
| Median | 10.7% | 12.7% |
| Interquartile 25% (IQ1) | 7.9% | 10.8% |
| Interquartile 75% (IQ3) | 11.7% | 15.5% |
| Interquartile Range (IQR) | 3.8% | 4.7% |
| Standard Deviation (Sample) | 3.6% | 4.0% |
| Standard Deviation (Population) | 3.6% | 3.9% |
Demographics Similar to Immigrants from Eritrea and Whites/Caucasians by Unemployment Among Youth under 25 years
In terms of unemployment among youth under 25 years, the demographic groups most similar to Immigrants from Eritrea are Scotch-Irish (11.1%, a difference of 0.040%), Immigrants from Eastern Africa (11.1%, a difference of 0.10%), South African (11.1%, a difference of 0.25%), Filipino (11.1%, a difference of 0.43%), and Immigrants from Netherlands (11.1%, a difference of 0.52%). Similarly, the demographic groups most similar to Whites/Caucasians are German Russian (11.2%, a difference of 0.050%), French (11.2%, a difference of 0.080%), New Zealander (11.2%, a difference of 0.11%), Creek (11.2%, a difference of 0.12%), and Immigrants from Australia (11.2%, a difference of 0.17%).
| Demographics | Rating | Rank | Unemployment Among Youth under 25 years |
| Immigrants | Eritrea | 98.8 /100 | #57 | Exceptional 11.1% |
| Scotch-Irish | 98.8 /100 | #58 | Exceptional 11.1% |
| Immigrants | Eastern Africa | 98.7 /100 | #59 | Exceptional 11.1% |
| South Africans | 98.5 /100 | #60 | Exceptional 11.1% |
| Filipinos | 98.3 /100 | #61 | Exceptional 11.1% |
| Immigrants | Netherlands | 98.1 /100 | #62 | Exceptional 11.1% |
| Immigrants | Croatia | 98.1 /100 | #63 | Exceptional 11.1% |
| Jordanians | 97.9 /100 | #64 | Exceptional 11.1% |
| Immigrants | Singapore | 97.8 /100 | #65 | Exceptional 11.2% |
| Macedonians | 97.7 /100 | #66 | Exceptional 11.2% |
| Chickasaw | 97.7 /100 | #67 | Exceptional 11.2% |
| Immigrants | Kenya | 97.6 /100 | #68 | Exceptional 11.2% |
| Immigrants | Moldova | 97.5 /100 | #69 | Exceptional 11.2% |
| Slavs | 97.5 /100 | #70 | Exceptional 11.2% |
| Bhutanese | 97.4 /100 | #71 | Exceptional 11.2% |
| Immigrants | Australia | 97.3 /100 | #72 | Exceptional 11.2% |
| Creek | 97.2 /100 | #73 | Exceptional 11.2% |
| New Zealanders | 97.2 /100 | #74 | Exceptional 11.2% |
| French | 97.1 /100 | #75 | Exceptional 11.2% |
| German Russians | 97.0 /100 | #76 | Exceptional 11.2% |
| Whites/Caucasians | 96.9 /100 | #77 | Exceptional 11.2% |