Immigrants from El Salvador vs Potawatomi Median Earnings
COMPARE
Immigrants from El Salvador
Potawatomi
Median Earnings
Median Earnings Comparison
Immigrants from El Salvador
Potawatomi
$42,413
MEDIAN EARNINGS
0.4/ 100
METRIC RATING
274th/ 347
METRIC RANK
$41,288
MEDIAN EARNINGS
0.1/ 100
METRIC RATING
294th/ 347
METRIC RANK
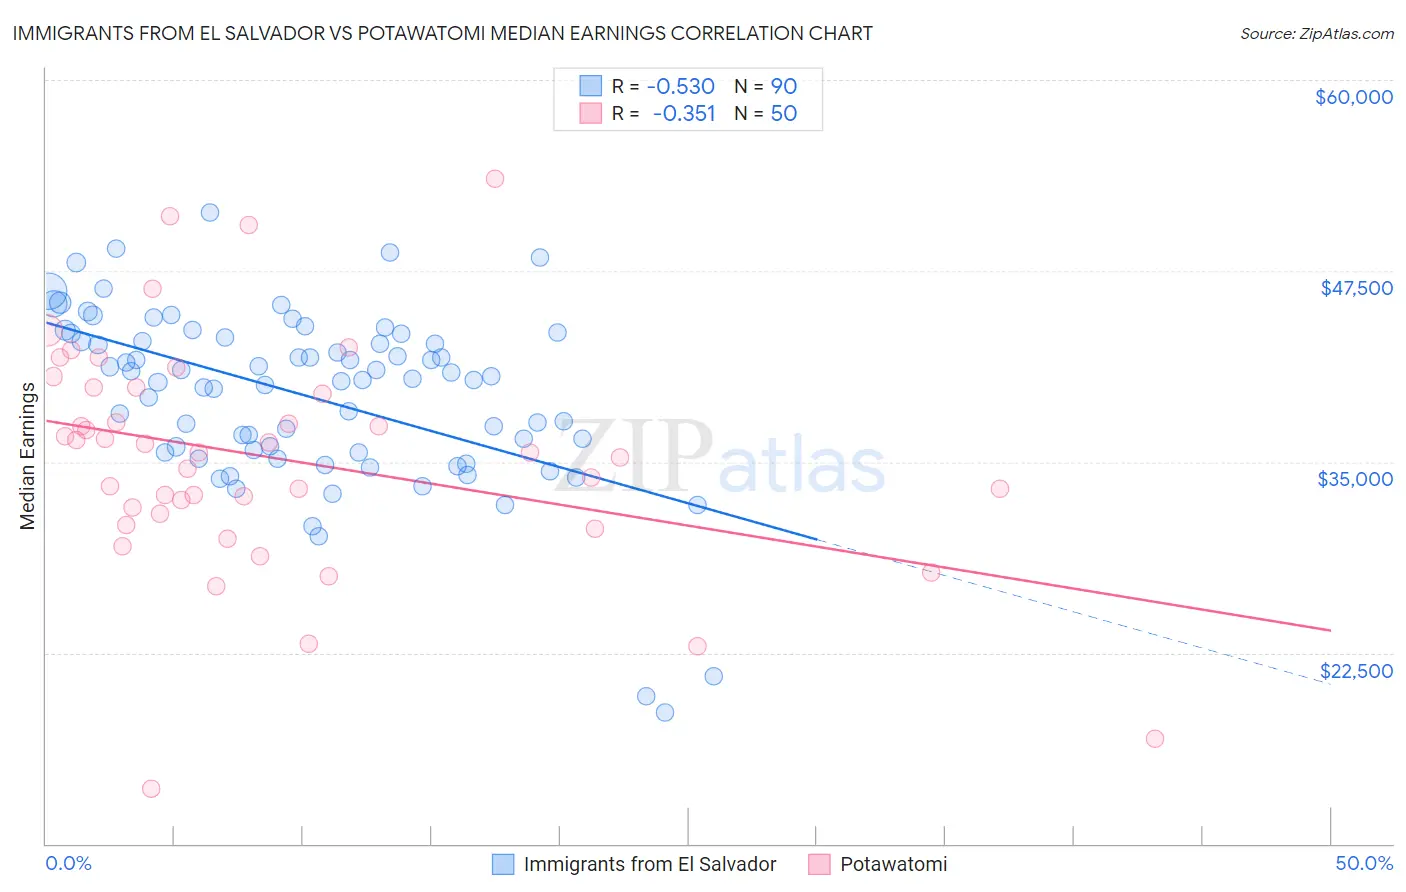
Immigrants from El Salvador vs Potawatomi Median Earnings Correlation Chart
The statistical analysis conducted on geographies consisting of 357,819,610 people shows a substantial negative correlation between the proportion of Immigrants from El Salvador and median earnings in the United States with a correlation coefficient (R) of -0.530 and weighted average of $42,413. Similarly, the statistical analysis conducted on geographies consisting of 117,770,629 people shows a mild negative correlation between the proportion of Potawatomi and median earnings in the United States with a correlation coefficient (R) of -0.351 and weighted average of $41,288, a difference of 2.7%.
Median Earnings Correlation Summary
| Measurement | Immigrants from El Salvador | Potawatomi |
| Minimum | $18,605 | $13,611 |
| Maximum | $51,289 | $53,523 |
| Range | $32,684 | $39,912 |
| Mean | $39,285 | $35,226 |
| Median | $40,413 | $35,630 |
| Interquartile 25% (IQ1) | $35,635 | $31,586 |
| Interquartile 75% (IQ3) | $43,130 | $39,871 |
| Interquartile Range (IQR) | $7,494 | $8,285 |
| Standard Deviation (Sample) | $5,807 | $7,629 |
| Standard Deviation (Population) | $5,775 | $7,552 |
Demographics Similar to Immigrants from El Salvador and Potawatomi by Median Earnings
In terms of median earnings, the demographic groups most similar to Immigrants from El Salvador are Immigrants from Belize ($42,339, a difference of 0.18%), Spanish American ($42,316, a difference of 0.23%), Central American ($42,280, a difference of 0.32%), Cajun ($42,189, a difference of 0.53%), and Colville ($42,151, a difference of 0.62%). Similarly, the demographic groups most similar to Potawatomi are Immigrants from Zaire ($41,325, a difference of 0.090%), U.S. Virgin Islander ($41,448, a difference of 0.39%), Central American Indian ($41,474, a difference of 0.45%), Paiute ($41,508, a difference of 0.53%), and Comanche ($41,519, a difference of 0.56%).
| Demographics | Rating | Rank | Median Earnings |
| Immigrants | El Salvador | 0.4 /100 | #274 | Tragic $42,413 |
| Immigrants | Belize | 0.3 /100 | #275 | Tragic $42,339 |
| Spanish Americans | 0.3 /100 | #276 | Tragic $42,316 |
| Central Americans | 0.3 /100 | #277 | Tragic $42,280 |
| Cajuns | 0.3 /100 | #278 | Tragic $42,189 |
| Colville | 0.2 /100 | #279 | Tragic $42,151 |
| Hmong | 0.2 /100 | #280 | Tragic $42,111 |
| Marshallese | 0.2 /100 | #281 | Tragic $41,969 |
| Africans | 0.2 /100 | #282 | Tragic $41,955 |
| Dominicans | 0.2 /100 | #283 | Tragic $41,864 |
| Blackfeet | 0.2 /100 | #284 | Tragic $41,822 |
| Immigrants | Nicaragua | 0.1 /100 | #285 | Tragic $41,737 |
| Mexican American Indians | 0.1 /100 | #286 | Tragic $41,719 |
| Indonesians | 0.1 /100 | #287 | Tragic $41,701 |
| Immigrants | Dominican Republic | 0.1 /100 | #288 | Tragic $41,554 |
| Comanche | 0.1 /100 | #289 | Tragic $41,519 |
| Paiute | 0.1 /100 | #290 | Tragic $41,508 |
| Central American Indians | 0.1 /100 | #291 | Tragic $41,474 |
| U.S. Virgin Islanders | 0.1 /100 | #292 | Tragic $41,448 |
| Immigrants | Zaire | 0.1 /100 | #293 | Tragic $41,325 |
| Potawatomi | 0.1 /100 | #294 | Tragic $41,288 |