Immigrants from Bolivia vs Immigrants from Turkey Median Earnings
COMPARE
Immigrants from Bolivia
Immigrants from Turkey
Median Earnings
Median Earnings Comparison
Immigrants from Bolivia
Immigrants from Turkey
$51,605
MEDIAN EARNINGS
99.9/ 100
METRIC RATING
58th/ 347
METRIC RANK
$52,960
MEDIAN EARNINGS
100.0/ 100
METRIC RATING
39th/ 347
METRIC RANK
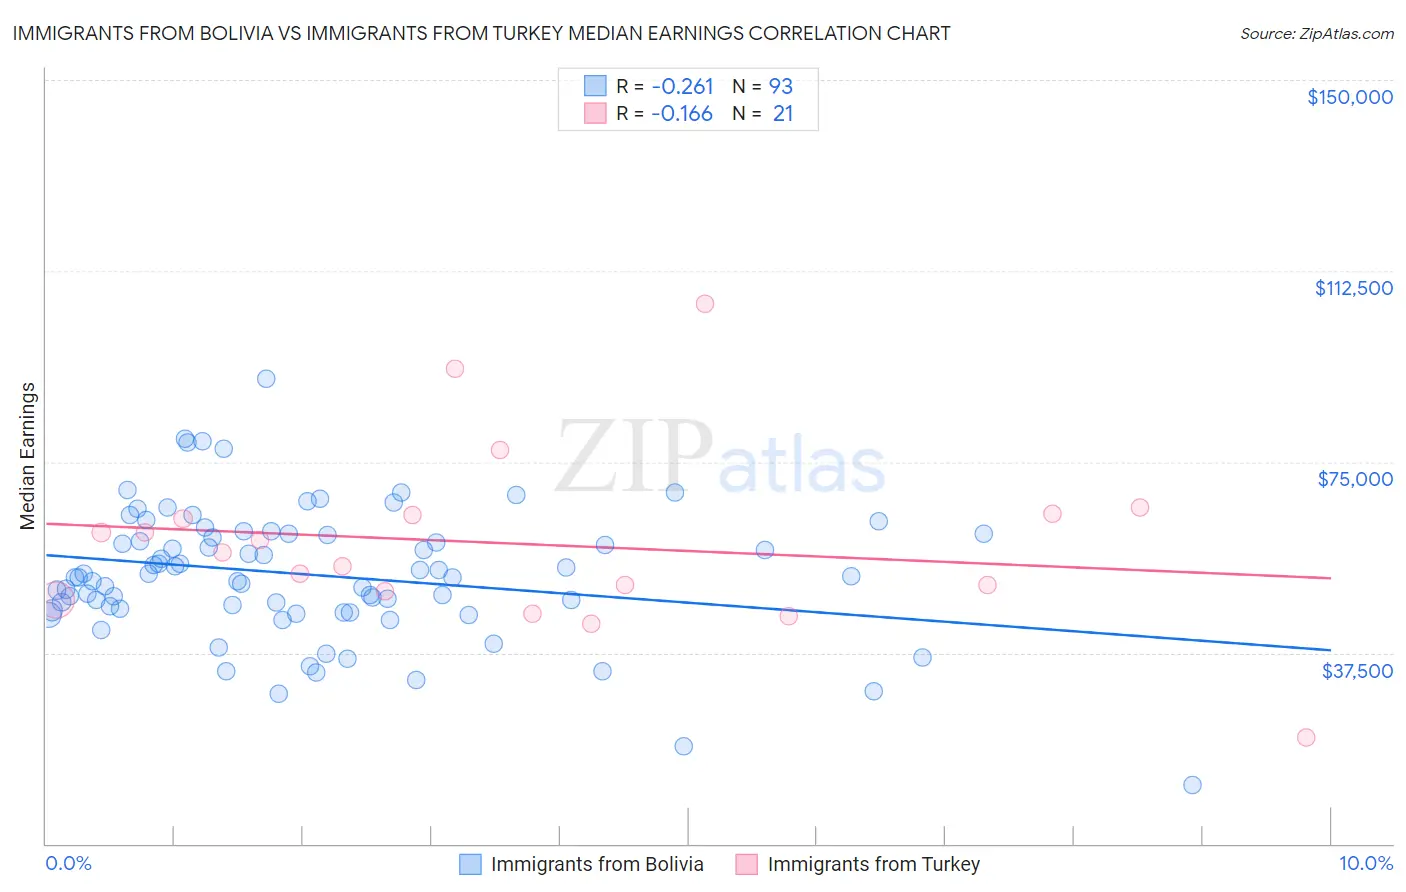
Immigrants from Bolivia vs Immigrants from Turkey Median Earnings Correlation Chart
The statistical analysis conducted on geographies consisting of 158,712,094 people shows a weak negative correlation between the proportion of Immigrants from Bolivia and median earnings in the United States with a correlation coefficient (R) of -0.261 and weighted average of $51,605. Similarly, the statistical analysis conducted on geographies consisting of 223,042,474 people shows a poor negative correlation between the proportion of Immigrants from Turkey and median earnings in the United States with a correlation coefficient (R) of -0.166 and weighted average of $52,960, a difference of 2.6%.
Median Earnings Correlation Summary
| Measurement | Immigrants from Bolivia | Immigrants from Turkey |
| Minimum | $11,650 | $20,750 |
| Maximum | $91,262 | $106,061 |
| Range | $79,612 | $85,311 |
| Mean | $52,755 | $58,831 |
| Median | $52,407 | $57,227 |
| Interquartile 25% (IQ1) | $46,026 | $48,717 |
| Interquartile 75% (IQ3) | $60,689 | $64,687 |
| Interquartile Range (IQR) | $14,663 | $15,970 |
| Standard Deviation (Sample) | $12,931 | $17,879 |
| Standard Deviation (Population) | $12,861 | $17,448 |
Demographics Similar to Immigrants from Bolivia and Immigrants from Turkey by Median Earnings
In terms of median earnings, the demographic groups most similar to Immigrants from Bolivia are Immigrants from Eastern Europe ($51,624, a difference of 0.040%), Immigrants from Pakistan ($51,693, a difference of 0.17%), Egyptian ($51,701, a difference of 0.18%), Immigrants from Indonesia ($51,715, a difference of 0.21%), and Immigrants from Norway ($51,758, a difference of 0.30%). Similarly, the demographic groups most similar to Immigrants from Turkey are Israeli ($52,937, a difference of 0.040%), Latvian ($53,001, a difference of 0.080%), Immigrants from Lithuania ($52,769, a difference of 0.36%), Maltese ($52,526, a difference of 0.83%), and Immigrants from Malaysia ($52,514, a difference of 0.85%).
| Demographics | Rating | Rank | Median Earnings |
| Latvians | 100.0 /100 | #38 | Exceptional $53,001 |
| Immigrants | Turkey | 100.0 /100 | #39 | Exceptional $52,960 |
| Israelis | 100.0 /100 | #40 | Exceptional $52,937 |
| Immigrants | Lithuania | 100.0 /100 | #41 | Exceptional $52,769 |
| Maltese | 100.0 /100 | #42 | Exceptional $52,526 |
| Immigrants | Malaysia | 100.0 /100 | #43 | Exceptional $52,514 |
| Bulgarians | 100.0 /100 | #44 | Exceptional $52,512 |
| Immigrants | Czechoslovakia | 100.0 /100 | #45 | Exceptional $52,361 |
| Bhutanese | 100.0 /100 | #46 | Exceptional $52,297 |
| Australians | 100.0 /100 | #47 | Exceptional $52,294 |
| Immigrants | Europe | 100.0 /100 | #48 | Exceptional $52,195 |
| Bolivians | 100.0 /100 | #49 | Exceptional $52,005 |
| Immigrants | South Africa | 100.0 /100 | #50 | Exceptional $51,850 |
| Immigrants | Austria | 99.9 /100 | #51 | Exceptional $51,826 |
| Estonians | 99.9 /100 | #52 | Exceptional $51,772 |
| Immigrants | Norway | 99.9 /100 | #53 | Exceptional $51,758 |
| Immigrants | Indonesia | 99.9 /100 | #54 | Exceptional $51,715 |
| Egyptians | 99.9 /100 | #55 | Exceptional $51,701 |
| Immigrants | Pakistan | 99.9 /100 | #56 | Exceptional $51,693 |
| Immigrants | Eastern Europe | 99.9 /100 | #57 | Exceptional $51,624 |
| Immigrants | Bolivia | 99.9 /100 | #58 | Exceptional $51,605 |