Immigrants from El Salvador vs Czech Householder Income Ages 45 - 64 years
COMPARE
Immigrants from El Salvador
Czech
Householder Income Ages 45 - 64 years
Householder Income Ages 45 - 64 years Comparison
Immigrants from El Salvador
Czechs
$93,176
HOUSEHOLDER INCOME AGES 45 - 64 YEARS
2.7/ 100
METRIC RATING
234th/ 347
METRIC RANK
$103,507
HOUSEHOLDER INCOME AGES 45 - 64 YEARS
83.1/ 100
METRIC RATING
144th/ 347
METRIC RANK
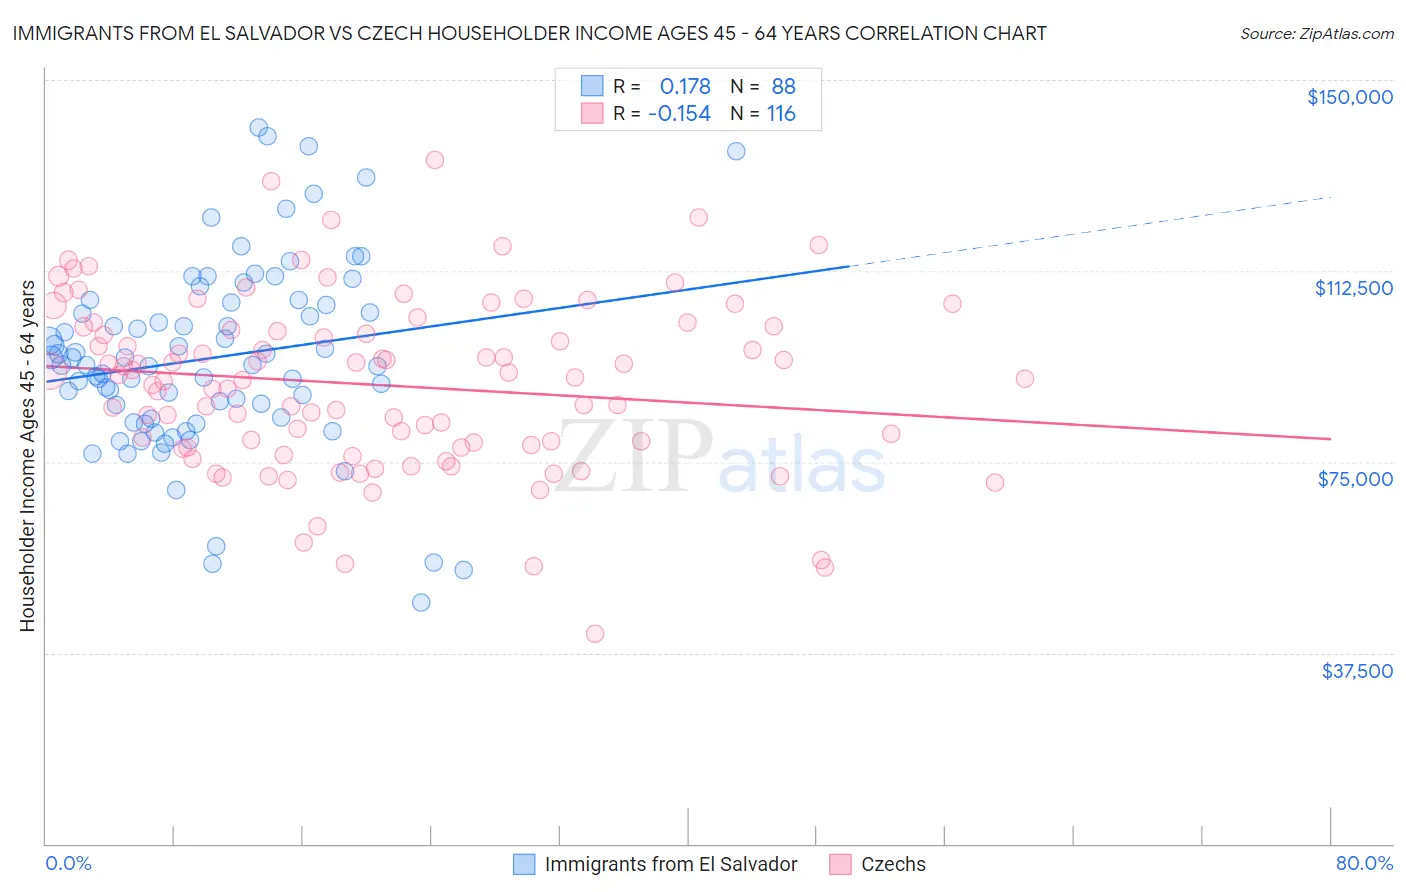
Immigrants from El Salvador vs Czech Householder Income Ages 45 - 64 years Correlation Chart
The statistical analysis conducted on geographies consisting of 357,351,830 people shows a poor positive correlation between the proportion of Immigrants from El Salvador and household income with householder between the ages 45 and 64 in the United States with a correlation coefficient (R) of 0.178 and weighted average of $93,176. Similarly, the statistical analysis conducted on geographies consisting of 483,421,339 people shows a poor negative correlation between the proportion of Czechs and household income with householder between the ages 45 and 64 in the United States with a correlation coefficient (R) of -0.154 and weighted average of $103,507, a difference of 11.1%.
Householder Income Ages 45 - 64 years Correlation Summary
| Measurement | Immigrants from El Salvador | Czech |
| Minimum | $47,339 | $41,250 |
| Maximum | $140,748 | $134,167 |
| Range | $93,409 | $92,917 |
| Mean | $95,436 | $90,131 |
| Median | $94,032 | $91,354 |
| Interquartile 25% (IQ1) | $83,646 | $78,110 |
| Interquartile 75% (IQ3) | $106,007 | $101,246 |
| Interquartile Range (IQR) | $22,361 | $23,136 |
| Standard Deviation (Sample) | $18,513 | $16,799 |
| Standard Deviation (Population) | $18,408 | $16,726 |
Similar Demographics by Householder Income Ages 45 - 64 years
Demographics Similar to Immigrants from El Salvador by Householder Income Ages 45 - 64 years
In terms of householder income ages 45 - 64 years, the demographic groups most similar to Immigrants from El Salvador are Nepalese ($93,355, a difference of 0.19%), Sudanese ($93,718, a difference of 0.58%), Ecuadorian ($93,739, a difference of 0.60%), Immigrants from Sudan ($93,781, a difference of 0.65%), and Vietnamese ($93,788, a difference of 0.66%).
| Demographics | Rating | Rank | Householder Income Ages 45 - 64 years |
| Alaska Natives | 4.0 /100 | #227 | Tragic $93,991 |
| Immigrants | Panama | 3.7 /100 | #228 | Tragic $93,815 |
| Vietnamese | 3.6 /100 | #229 | Tragic $93,788 |
| Immigrants | Sudan | 3.6 /100 | #230 | Tragic $93,781 |
| Ecuadorians | 3.6 /100 | #231 | Tragic $93,739 |
| Sudanese | 3.5 /100 | #232 | Tragic $93,718 |
| Nepalese | 3.0 /100 | #233 | Tragic $93,355 |
| Immigrants | El Salvador | 2.7 /100 | #234 | Tragic $93,176 |
| Nicaraguans | 2.0 /100 | #235 | Tragic $92,554 |
| Immigrants | Western Africa | 1.8 /100 | #236 | Tragic $92,384 |
| Immigrants | Bangladesh | 1.7 /100 | #237 | Tragic $92,208 |
| Pennsylvania Germans | 1.5 /100 | #238 | Tragic $91,956 |
| Immigrants | Ecuador | 1.2 /100 | #239 | Tragic $91,462 |
| Immigrants | Burma/Myanmar | 1.1 /100 | #240 | Tragic $91,385 |
| Trinidadians and Tobagonians | 1.1 /100 | #241 | Tragic $91,357 |
Demographics Similar to Czechs by Householder Income Ages 45 - 64 years
In terms of householder income ages 45 - 64 years, the demographic groups most similar to Czechs are Serbian ($103,522, a difference of 0.010%), Luxembourger ($103,536, a difference of 0.030%), Ugandan ($103,472, a difference of 0.030%), Immigrants from Uganda ($103,584, a difference of 0.070%), and Immigrants from Chile ($103,412, a difference of 0.090%).
| Demographics | Rating | Rank | Householder Income Ages 45 - 64 years |
| Hungarians | 85.8 /100 | #137 | Excellent $103,913 |
| Ethiopians | 84.7 /100 | #138 | Excellent $103,736 |
| Immigrants | Oceania | 84.5 /100 | #139 | Excellent $103,705 |
| Norwegians | 84.3 /100 | #140 | Excellent $103,682 |
| Immigrants | Uganda | 83.7 /100 | #141 | Excellent $103,584 |
| Luxembourgers | 83.3 /100 | #142 | Excellent $103,536 |
| Serbians | 83.2 /100 | #143 | Excellent $103,522 |
| Czechs | 83.1 /100 | #144 | Excellent $103,507 |
| Ugandans | 82.9 /100 | #145 | Excellent $103,472 |
| Immigrants | Chile | 82.5 /100 | #146 | Excellent $103,412 |
| Basques | 82.3 /100 | #147 | Excellent $103,387 |
| Immigrants | Germany | 81.5 /100 | #148 | Excellent $103,282 |
| Immigrants | Sierra Leone | 81.1 /100 | #149 | Excellent $103,227 |
| Immigrants | Peru | 80.7 /100 | #150 | Excellent $103,173 |
| Swiss | 79.9 /100 | #151 | Good $103,071 |