Immigrants from El Salvador vs Central American Unemployment Among Ages 55 to 59 years
COMPARE
Immigrants from El Salvador
Central American
Unemployment Among Ages 55 to 59 years
Unemployment Among Ages 55 to 59 years Comparison
Immigrants from El Salvador
Central Americans
5.1%
UNEMPLOYMENT AMONG AGES 55 TO 59 YEARS
0.1/ 100
METRIC RATING
262nd/ 347
METRIC RANK
5.1%
UNEMPLOYMENT AMONG AGES 55 TO 59 YEARS
0.2/ 100
METRIC RATING
257th/ 347
METRIC RANK
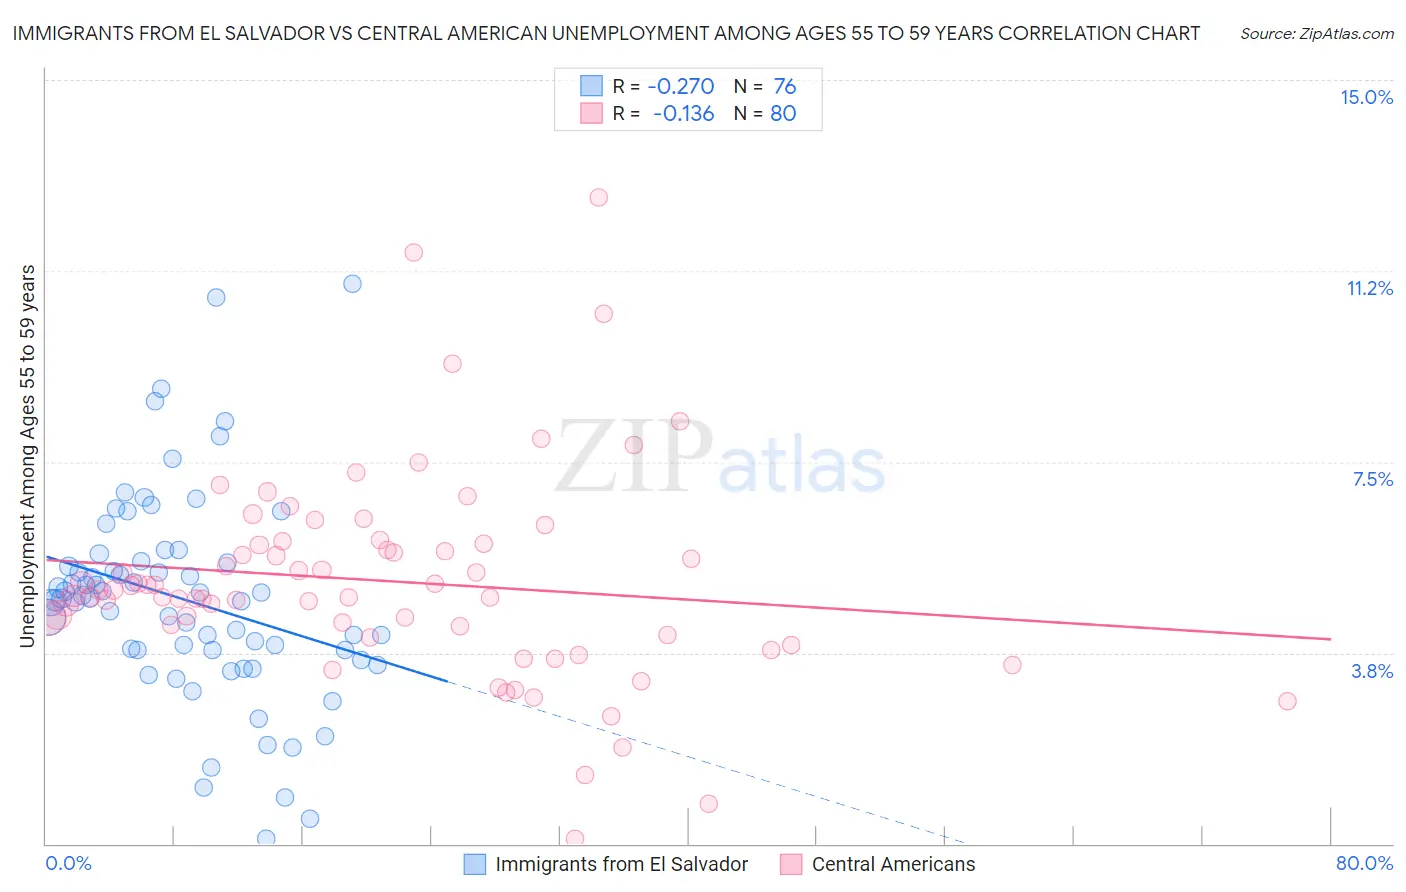
Immigrants from El Salvador vs Central American Unemployment Among Ages 55 to 59 years Correlation Chart
The statistical analysis conducted on geographies consisting of 336,036,102 people shows a weak negative correlation between the proportion of Immigrants from El Salvador and unemployment rate among population between the ages 55 and 59 in the United States with a correlation coefficient (R) of -0.270 and weighted average of 5.1%. Similarly, the statistical analysis conducted on geographies consisting of 452,699,572 people shows a poor negative correlation between the proportion of Central Americans and unemployment rate among population between the ages 55 and 59 in the United States with a correlation coefficient (R) of -0.136 and weighted average of 5.1%, a difference of 0.38%.
Unemployment Among Ages 55 to 59 years Correlation Summary
| Measurement | Immigrants from El Salvador | Central American |
| Minimum | 0.10% | 0.10% |
| Maximum | 11.0% | 12.7% |
| Range | 10.9% | 12.6% |
| Mean | 4.8% | 5.2% |
| Median | 4.8% | 4.9% |
| Interquartile 25% (IQ1) | 3.8% | 4.2% |
| Interquartile 75% (IQ3) | 5.5% | 5.9% |
| Interquartile Range (IQR) | 1.7% | 1.7% |
| Standard Deviation (Sample) | 2.0% | 2.0% |
| Standard Deviation (Population) | 2.0% | 2.0% |
Demographics Similar to Immigrants from El Salvador and Central Americans by Unemployment Among Ages 55 to 59 years
In terms of unemployment among ages 55 to 59 years, the demographic groups most similar to Immigrants from El Salvador are African (5.1%, a difference of 0.070%), Immigrants from Western Africa (5.1%, a difference of 0.17%), Immigrants from Sierra Leone (5.2%, a difference of 0.19%), Immigrants from West Indies (5.1%, a difference of 0.28%), and Immigrants from Caribbean (5.2%, a difference of 0.29%). Similarly, the demographic groups most similar to Central Americans are Salvadoran (5.1%, a difference of 0.010%), Immigrants from West Indies (5.1%, a difference of 0.10%), Immigrants from Western Africa (5.1%, a difference of 0.21%), Senegalese (5.1%, a difference of 0.27%), and African (5.1%, a difference of 0.31%).
| Demographics | Rating | Rank | Unemployment Among Ages 55 to 59 years |
| Comanche | 0.4 /100 | #249 | Tragic 5.1% |
| Cheyenne | 0.4 /100 | #250 | Tragic 5.1% |
| Portuguese | 0.3 /100 | #251 | Tragic 5.1% |
| U.S. Virgin Islanders | 0.3 /100 | #252 | Tragic 5.1% |
| Paraguayans | 0.3 /100 | #253 | Tragic 5.1% |
| Seminole | 0.3 /100 | #254 | Tragic 5.1% |
| Blackfeet | 0.3 /100 | #255 | Tragic 5.1% |
| Senegalese | 0.3 /100 | #256 | Tragic 5.1% |
| Central Americans | 0.2 /100 | #257 | Tragic 5.1% |
| Salvadorans | 0.2 /100 | #258 | Tragic 5.1% |
| Immigrants | West Indies | 0.2 /100 | #259 | Tragic 5.1% |
| Immigrants | Western Africa | 0.2 /100 | #260 | Tragic 5.1% |
| Africans | 0.1 /100 | #261 | Tragic 5.1% |
| Immigrants | El Salvador | 0.1 /100 | #262 | Tragic 5.1% |
| Immigrants | Sierra Leone | 0.1 /100 | #263 | Tragic 5.2% |
| Immigrants | Caribbean | 0.1 /100 | #264 | Tragic 5.2% |
| Yaqui | 0.1 /100 | #265 | Tragic 5.2% |
| Jamaicans | 0.1 /100 | #266 | Tragic 5.2% |
| Immigrants | Senegal | 0.1 /100 | #267 | Tragic 5.2% |
| Mexicans | 0.1 /100 | #268 | Tragic 5.2% |
| Tsimshian | 0.1 /100 | #269 | Tragic 5.2% |