Immigrants from Dominican Republic vs Sioux In Labor Force | Age 16-19
COMPARE
Immigrants from Dominican Republic
Sioux
In Labor Force | Age 16-19
In Labor Force | Age 16-19 Comparison
Immigrants from Dominican Republic
Sioux
31.1%
IN LABOR FORCE | AGE 16-19
0.0/ 100
METRIC RATING
326th/ 347
METRIC RANK
41.5%
IN LABOR FORCE | AGE 16-19
100.0/ 100
METRIC RATING
38th/ 347
METRIC RANK
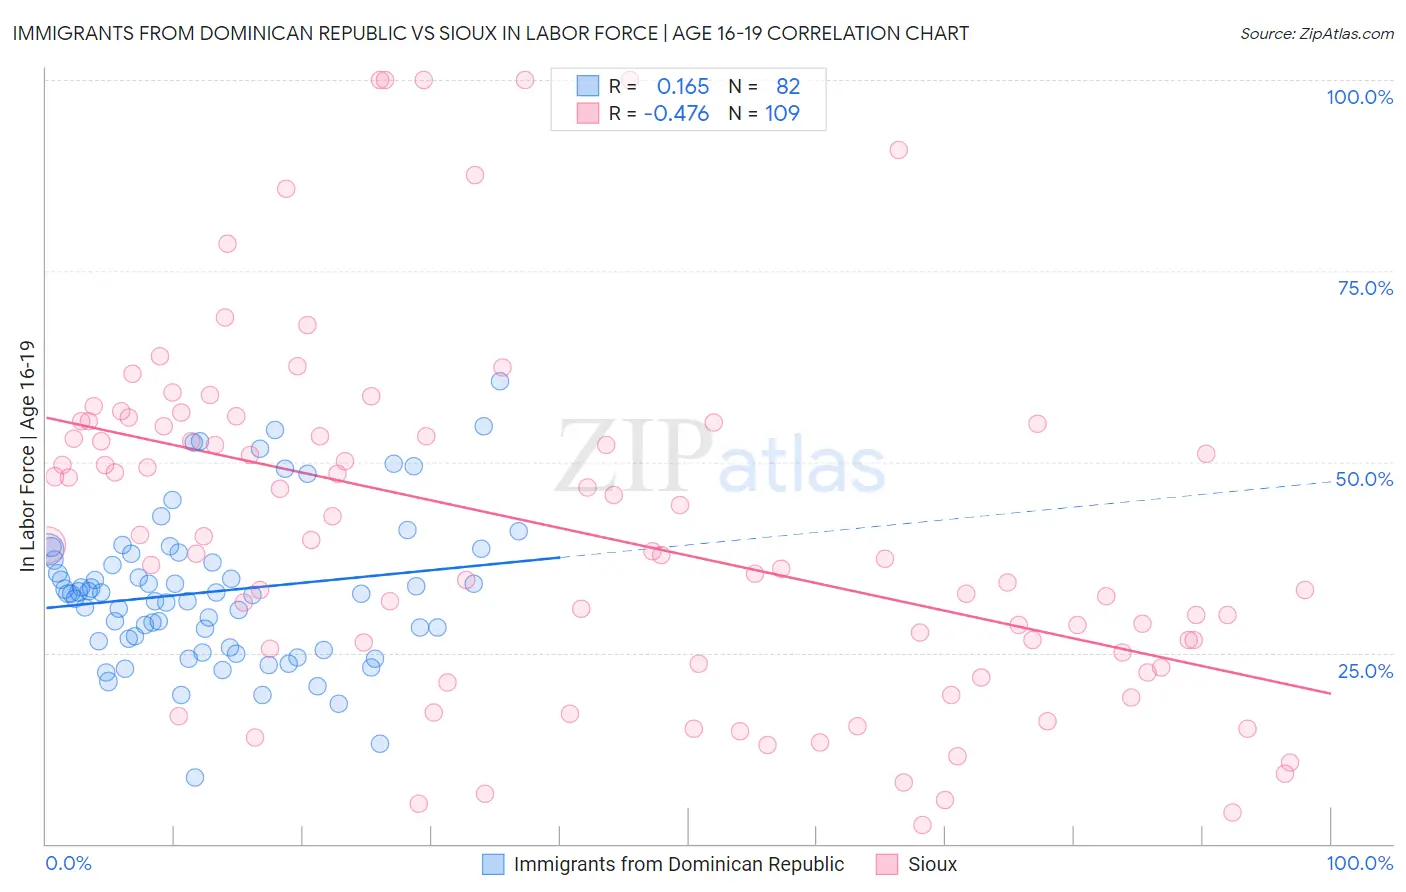
Immigrants from Dominican Republic vs Sioux In Labor Force | Age 16-19 Correlation Chart
The statistical analysis conducted on geographies consisting of 274,798,225 people shows a poor positive correlation between the proportion of Immigrants from Dominican Republic and labor force participation rate among population between the ages 16 and 19 in the United States with a correlation coefficient (R) of 0.165 and weighted average of 31.1%. Similarly, the statistical analysis conducted on geographies consisting of 233,888,038 people shows a moderate negative correlation between the proportion of Sioux and labor force participation rate among population between the ages 16 and 19 in the United States with a correlation coefficient (R) of -0.476 and weighted average of 41.5%, a difference of 33.7%.
In Labor Force | Age 16-19 Correlation Summary
| Measurement | Immigrants from Dominican Republic | Sioux |
| Minimum | 8.7% | 2.4% |
| Maximum | 60.5% | 100.0% |
| Range | 51.8% | 97.6% |
| Mean | 33.0% | 41.1% |
| Median | 32.7% | 38.3% |
| Interquartile 25% (IQ1) | 26.5% | 24.2% |
| Interquartile 75% (IQ3) | 38.0% | 54.9% |
| Interquartile Range (IQR) | 11.5% | 30.6% |
| Standard Deviation (Sample) | 9.7% | 23.0% |
| Standard Deviation (Population) | 9.7% | 22.9% |
Similar Demographics by In Labor Force | Age 16-19
Demographics Similar to Immigrants from Dominican Republic by In Labor Force | Age 16-19
In terms of in labor force | age 16-19, the demographic groups most similar to Immigrants from Dominican Republic are Immigrants from Taiwan (31.0%, a difference of 0.16%), Immigrants from China (31.1%, a difference of 0.20%), Immigrants from Ecuador (31.0%, a difference of 0.20%), Barbadian (31.0%, a difference of 0.23%), and Dominican (31.2%, a difference of 0.35%).
| Demographics | Rating | Rank | In Labor Force | Age 16-19 |
| Soviet Union | 0.0 /100 | #319 | Tragic 31.4% |
| Ecuadorians | 0.0 /100 | #320 | Tragic 31.4% |
| West Indians | 0.0 /100 | #321 | Tragic 31.3% |
| Tohono O'odham | 0.0 /100 | #322 | Tragic 31.3% |
| Immigrants | Caribbean | 0.0 /100 | #323 | Tragic 31.2% |
| Dominicans | 0.0 /100 | #324 | Tragic 31.2% |
| Immigrants | China | 0.0 /100 | #325 | Tragic 31.1% |
| Immigrants | Dominican Republic | 0.0 /100 | #326 | Tragic 31.1% |
| Immigrants | Taiwan | 0.0 /100 | #327 | Tragic 31.0% |
| Immigrants | Ecuador | 0.0 /100 | #328 | Tragic 31.0% |
| Barbadians | 0.0 /100 | #329 | Tragic 31.0% |
| Lumbee | 0.0 /100 | #330 | Tragic 31.0% |
| Trinidadians and Tobagonians | 0.0 /100 | #331 | Tragic 30.9% |
| Immigrants | Israel | 0.0 /100 | #332 | Tragic 30.5% |
| Immigrants | Hong Kong | 0.0 /100 | #333 | Tragic 30.5% |
Demographics Similar to Sioux by In Labor Force | Age 16-19
In terms of in labor force | age 16-19, the demographic groups most similar to Sioux are Scotch-Irish (41.5%, a difference of 0.14%), Immigrants from Liberia (41.5%, a difference of 0.23%), Immigrants from Congo (41.7%, a difference of 0.35%), Immigrants from the Azores (41.7%, a difference of 0.42%), and Yugoslavian (41.8%, a difference of 0.57%).
| Demographics | Rating | Rank | In Labor Force | Age 16-19 |
| Irish | 100.0 /100 | #31 | Exceptional 42.0% |
| Czechoslovakians | 100.0 /100 | #32 | Exceptional 41.9% |
| Liberians | 100.0 /100 | #33 | Exceptional 41.8% |
| Immigrants | Bosnia and Herzegovina | 100.0 /100 | #34 | Exceptional 41.8% |
| Yugoslavians | 100.0 /100 | #35 | Exceptional 41.8% |
| Immigrants | Azores | 100.0 /100 | #36 | Exceptional 41.7% |
| Immigrants | Congo | 100.0 /100 | #37 | Exceptional 41.7% |
| Sioux | 100.0 /100 | #38 | Exceptional 41.5% |
| Scotch-Irish | 100.0 /100 | #39 | Exceptional 41.5% |
| Immigrants | Liberia | 100.0 /100 | #40 | Exceptional 41.5% |
| Celtics | 100.0 /100 | #41 | Exceptional 41.3% |
| Whites/Caucasians | 100.0 /100 | #42 | Exceptional 41.3% |
| Tongans | 100.0 /100 | #43 | Exceptional 41.2% |
| Europeans | 100.0 /100 | #44 | Exceptional 41.1% |
| Croatians | 100.0 /100 | #45 | Exceptional 41.1% |