Immigrants from Dominican Republic vs Jamaican 2nd Grade
COMPARE
Immigrants from Dominican Republic
Jamaican
2nd Grade
2nd Grade Comparison
Immigrants from Dominican Republic
Jamaicans
96.4%
2ND GRADE
0.0/ 100
METRIC RATING
333rd/ 347
METRIC RANK
97.5%
2ND GRADE
0.6/ 100
METRIC RATING
256th/ 347
METRIC RANK
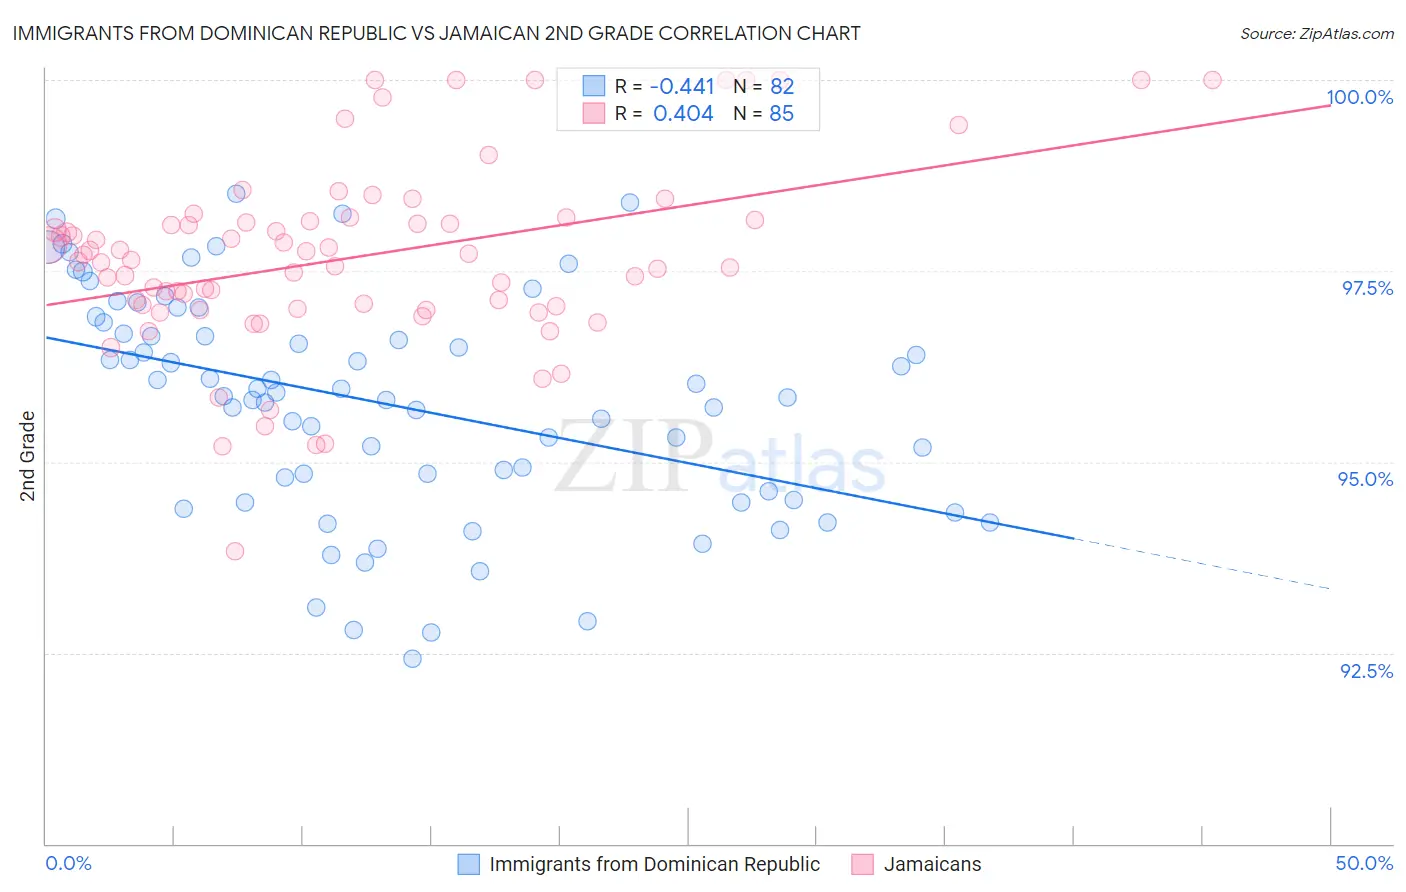
Immigrants from Dominican Republic vs Jamaican 2nd Grade Correlation Chart
The statistical analysis conducted on geographies consisting of 275,142,551 people shows a moderate negative correlation between the proportion of Immigrants from Dominican Republic and percentage of population with at least 2nd grade education in the United States with a correlation coefficient (R) of -0.441 and weighted average of 96.4%. Similarly, the statistical analysis conducted on geographies consisting of 368,084,732 people shows a moderate positive correlation between the proportion of Jamaicans and percentage of population with at least 2nd grade education in the United States with a correlation coefficient (R) of 0.404 and weighted average of 97.5%, a difference of 1.1%.
2nd Grade Correlation Summary
| Measurement | Immigrants from Dominican Republic | Jamaican |
| Minimum | 92.4% | 93.8% |
| Maximum | 98.5% | 100.0% |
| Range | 6.1% | 6.2% |
| Mean | 95.8% | 97.7% |
| Median | 95.9% | 97.7% |
| Interquartile 25% (IQ1) | 94.6% | 97.0% |
| Interquartile 75% (IQ3) | 96.8% | 98.2% |
| Interquartile Range (IQR) | 2.2% | 1.1% |
| Standard Deviation (Sample) | 1.5% | 1.2% |
| Standard Deviation (Population) | 1.4% | 1.2% |
Similar Demographics by 2nd Grade
Demographics Similar to Immigrants from Dominican Republic by 2nd Grade
In terms of 2nd grade, the demographic groups most similar to Immigrants from Dominican Republic are Central American (96.4%, a difference of 0.020%), Yakama (96.4%, a difference of 0.030%), Immigrants from Fiji (96.4%, a difference of 0.040%), Immigrants from Cambodia (96.4%, a difference of 0.050%), and Bangladeshi (96.5%, a difference of 0.060%).
| Demographics | Rating | Rank | 2nd Grade |
| Immigrants | Honduras | 0.0 /100 | #326 | Tragic 96.6% |
| Immigrants | Vietnam | 0.0 /100 | #327 | Tragic 96.5% |
| Mexicans | 0.0 /100 | #328 | Tragic 96.5% |
| Japanese | 0.0 /100 | #329 | Tragic 96.5% |
| Immigrants | Latin America | 0.0 /100 | #330 | Tragic 96.5% |
| Immigrants | Armenia | 0.0 /100 | #331 | Tragic 96.5% |
| Bangladeshis | 0.0 /100 | #332 | Tragic 96.5% |
| Immigrants | Dominican Republic | 0.0 /100 | #333 | Tragic 96.4% |
| Central Americans | 0.0 /100 | #334 | Tragic 96.4% |
| Yakama | 0.0 /100 | #335 | Tragic 96.4% |
| Immigrants | Fiji | 0.0 /100 | #336 | Tragic 96.4% |
| Immigrants | Cambodia | 0.0 /100 | #337 | Tragic 96.4% |
| Immigrants | Cabo Verde | 0.0 /100 | #338 | Tragic 96.3% |
| Guatemalans | 0.0 /100 | #339 | Tragic 96.3% |
| Immigrants | Guatemala | 0.0 /100 | #340 | Tragic 96.2% |
Demographics Similar to Jamaicans by 2nd Grade
In terms of 2nd grade, the demographic groups most similar to Jamaicans are Indian (Asian) (97.5%, a difference of 0.0%), Immigrants from Congo (97.5%, a difference of 0.0%), Immigrants from Colombia (97.5%, a difference of 0.0%), Yaqui (97.5%, a difference of 0.010%), and Fijian (97.5%, a difference of 0.010%).
| Demographics | Rating | Rank | 2nd Grade |
| Bolivians | 0.9 /100 | #249 | Tragic 97.5% |
| Peruvians | 0.9 /100 | #250 | Tragic 97.5% |
| Immigrants | Africa | 0.8 /100 | #251 | Tragic 97.5% |
| Immigrants | Asia | 0.7 /100 | #252 | Tragic 97.5% |
| Puerto Ricans | 0.7 /100 | #253 | Tragic 97.5% |
| Indians (Asian) | 0.6 /100 | #254 | Tragic 97.5% |
| Immigrants | Congo | 0.6 /100 | #255 | Tragic 97.5% |
| Jamaicans | 0.6 /100 | #256 | Tragic 97.5% |
| Immigrants | Colombia | 0.5 /100 | #257 | Tragic 97.5% |
| Yaqui | 0.5 /100 | #258 | Tragic 97.5% |
| Fijians | 0.5 /100 | #259 | Tragic 97.5% |
| Assyrians/Chaldeans/Syriacs | 0.5 /100 | #260 | Tragic 97.5% |
| Armenians | 0.5 /100 | #261 | Tragic 97.5% |
| Taiwanese | 0.4 /100 | #262 | Tragic 97.4% |
| Immigrants | Ethiopia | 0.4 /100 | #263 | Tragic 97.4% |