Dutch vs Jamaican Per Capita Income
COMPARE
Dutch
Jamaican
Per Capita Income
Per Capita Income Comparison
Dutch
Jamaicans
$42,605
PER CAPITA INCOME
23.4/ 100
METRIC RATING
196th/ 347
METRIC RANK
$39,231
PER CAPITA INCOME
0.7/ 100
METRIC RATING
258th/ 347
METRIC RANK
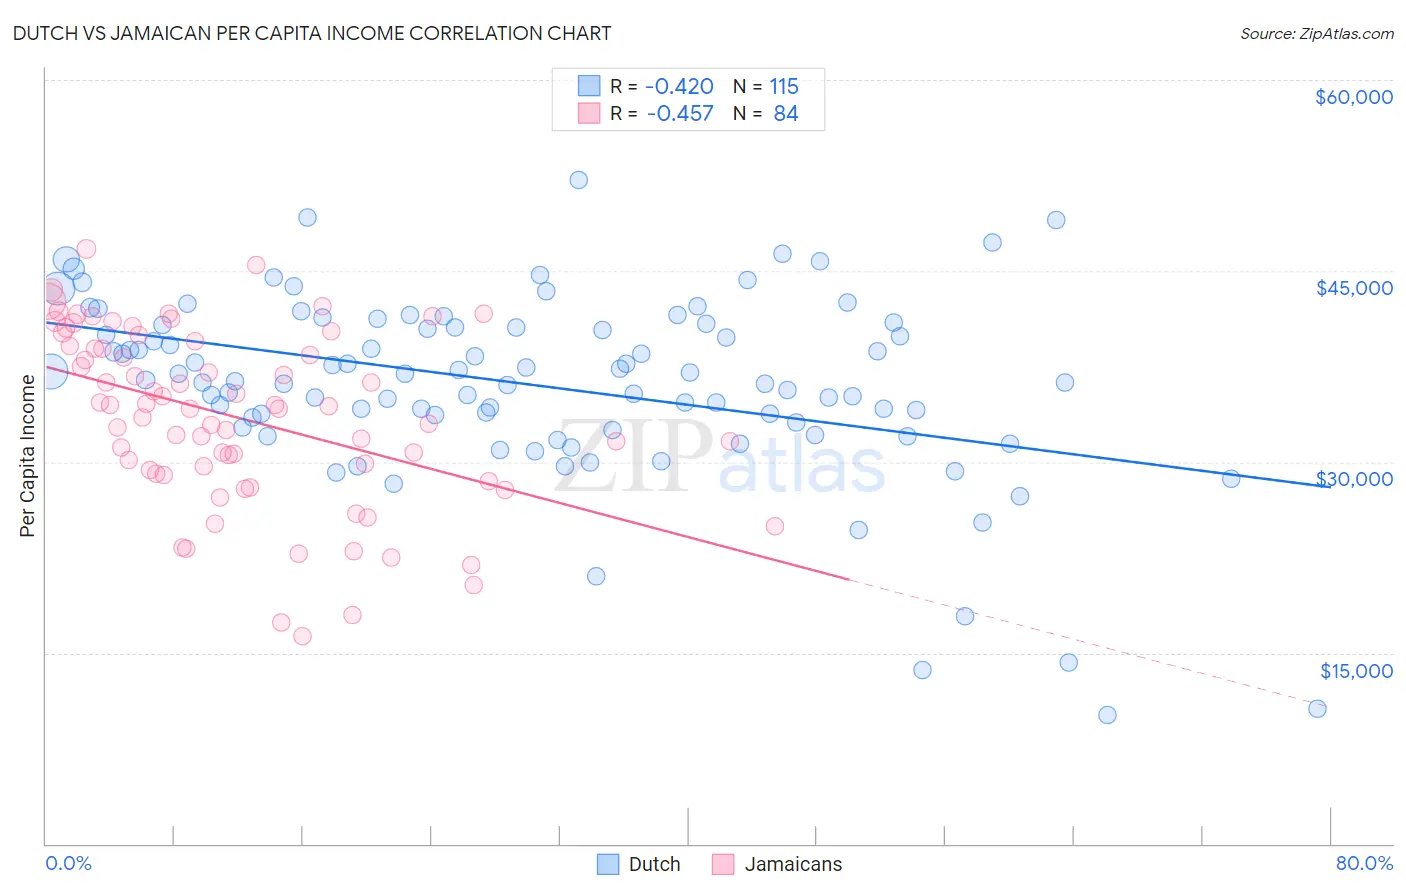
Dutch vs Jamaican Per Capita Income Correlation Chart
The statistical analysis conducted on geographies consisting of 554,404,949 people shows a moderate negative correlation between the proportion of Dutch and per capita income in the United States with a correlation coefficient (R) of -0.420 and weighted average of $42,605. Similarly, the statistical analysis conducted on geographies consisting of 368,110,686 people shows a moderate negative correlation between the proportion of Jamaicans and per capita income in the United States with a correlation coefficient (R) of -0.457 and weighted average of $39,231, a difference of 8.6%.
Per Capita Income Correlation Summary
| Measurement | Dutch | Jamaican |
| Minimum | $10,108 | $16,350 |
| Maximum | $52,150 | $46,707 |
| Range | $42,042 | $30,357 |
| Mean | $36,061 | $33,502 |
| Median | $36,441 | $34,287 |
| Interquartile 25% (IQ1) | $33,045 | $29,169 |
| Interquartile 75% (IQ3) | $40,758 | $39,281 |
| Interquartile Range (IQR) | $7,713 | $10,112 |
| Standard Deviation (Sample) | $7,274 | $6,895 |
| Standard Deviation (Population) | $7,242 | $6,854 |
Similar Demographics by Per Capita Income
Demographics Similar to Dutch by Per Capita Income
In terms of per capita income, the demographic groups most similar to Dutch are Scotch-Irish ($42,563, a difference of 0.10%), Immigrants from Kenya ($42,661, a difference of 0.13%), Immigrants from Fiji ($42,694, a difference of 0.21%), Immigrants from Sierra Leone ($42,752, a difference of 0.34%), and Iraqi ($42,760, a difference of 0.36%).
| Demographics | Rating | Rank | Per Capita Income |
| Bermudans | 30.1 /100 | #189 | Fair $42,911 |
| Kenyans | 27.7 /100 | #190 | Fair $42,808 |
| Yugoslavians | 27.4 /100 | #191 | Fair $42,792 |
| Iraqis | 26.7 /100 | #192 | Fair $42,760 |
| Immigrants | Sierra Leone | 26.5 /100 | #193 | Fair $42,752 |
| Immigrants | Fiji | 25.2 /100 | #194 | Fair $42,694 |
| Immigrants | Kenya | 24.5 /100 | #195 | Fair $42,661 |
| Dutch | 23.4 /100 | #196 | Fair $42,605 |
| Scotch-Irish | 22.6 /100 | #197 | Fair $42,563 |
| Immigrants | Portugal | 19.7 /100 | #198 | Poor $42,412 |
| Barbadians | 19.6 /100 | #199 | Poor $42,406 |
| Vietnamese | 19.0 /100 | #200 | Poor $42,368 |
| Immigrants | Thailand | 17.6 /100 | #201 | Poor $42,289 |
| Immigrants | Bosnia and Herzegovina | 17.5 /100 | #202 | Poor $42,278 |
| Spanish | 17.0 /100 | #203 | Poor $42,249 |
Demographics Similar to Jamaicans by Per Capita Income
In terms of per capita income, the demographic groups most similar to Jamaicans are Malaysian ($39,194, a difference of 0.090%), Alaskan Athabascan ($39,163, a difference of 0.17%), Marshallese ($39,108, a difference of 0.31%), Iroquois ($39,104, a difference of 0.33%), and Belizean ($39,097, a difference of 0.34%).
| Demographics | Rating | Rank | Per Capita Income |
| Samoans | 1.3 /100 | #251 | Tragic $39,826 |
| Immigrants | Azores | 1.0 /100 | #252 | Tragic $39,608 |
| Osage | 1.0 /100 | #253 | Tragic $39,568 |
| Alaska Natives | 1.0 /100 | #254 | Tragic $39,558 |
| Immigrants | Middle Africa | 1.0 /100 | #255 | Tragic $39,529 |
| Hawaiians | 0.8 /100 | #256 | Tragic $39,403 |
| Nicaraguans | 0.8 /100 | #257 | Tragic $39,372 |
| Jamaicans | 0.7 /100 | #258 | Tragic $39,231 |
| Malaysians | 0.7 /100 | #259 | Tragic $39,194 |
| Alaskan Athabascans | 0.6 /100 | #260 | Tragic $39,163 |
| Marshallese | 0.6 /100 | #261 | Tragic $39,108 |
| Iroquois | 0.6 /100 | #262 | Tragic $39,104 |
| Belizeans | 0.6 /100 | #263 | Tragic $39,097 |
| Americans | 0.6 /100 | #264 | Tragic $39,039 |
| Spanish Americans | 0.5 /100 | #265 | Tragic $39,012 |